October 15, 2012
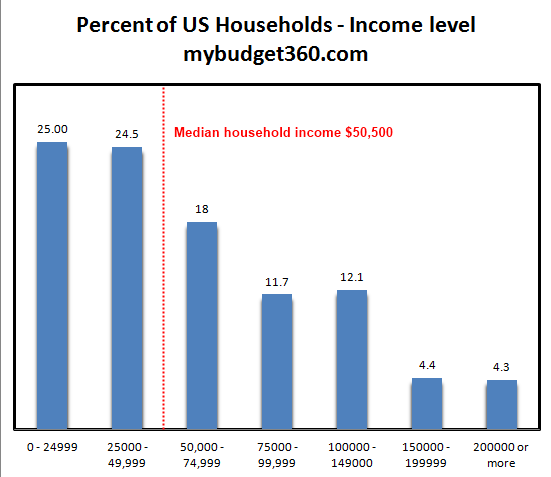
People have a hard time wrapping their minds around household and personal income. It is an easy enough concept to understand but some throw around terminology that confuses the facts. For example $250,000 is not middle class income if we define it from a strictly mathematical model. The median household income in the US is $50,500. In other words, half make more than $50,000 and half make less. If you as an individual made more than $250,000 that would put you in the top one percent of all earners in the US. For households making more than $250,000 per year this would put you in the top two percent of US households. Let us look at the income data carefully.
US household incomes
First it is important to actually break down the data from the Census:
Source: Census, ACS 2011
The latest Census data has the median household income in the US at $50,500. But as the chart above highlights one out of four US households are living with less than $25,000 per year in household income. This makes sense when we measure this up against Social Security data that has the median per capita worker income at $26,000 for 2010. You also begin to realize why two income households are almost a necessity to get by in American today.
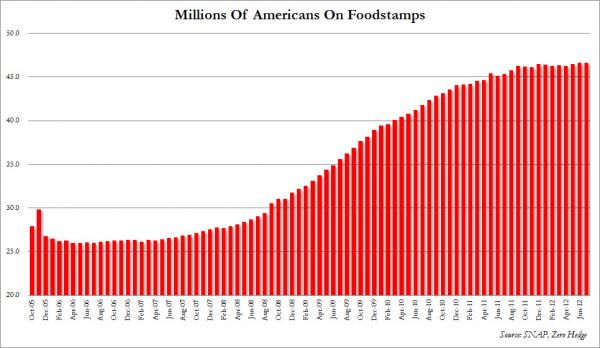
In fact, if you are in a household that makes more than $100,000 per year you are in the top 20 percent of all US households. As we mentioned earlier, making more than $250,000 is nowhere close to “middle class” if we actually follow the rules of math. Sure, some might feel they are middle class at these levels but they are missing the bigger picture in that many Americans are barely scraping by (they are in the top two percent here). We have over 46,500,000 Americans on food stamps both a raw record and a record as measured by the percent of our population on this program.
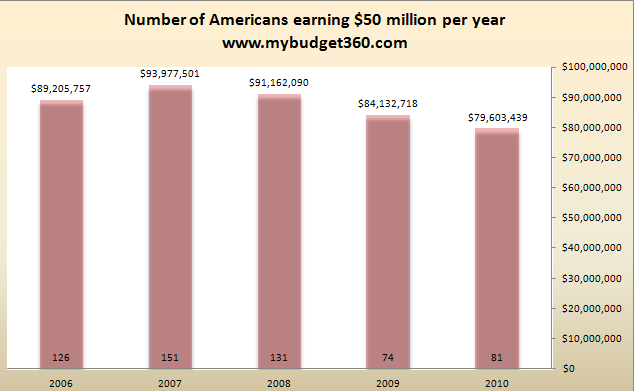
If you want to take a glimpse at the very high end of earners, we can look at those making more than $50,000,000 per year:
The number of those making $50,000,000 or more has certainly fallen since the peak in 2007. It’ll be interesting once we have 2011 data since this will capture the big stock rally we have had since early 2009. In 2010 only 81 Americans made it to this level.
I find household income data the most relevant because it gives a true sense as to where the typical US household really is in the current economy. The $50,000 median income level tells us a lot but it doesn’t really explain the extremes. Why in this recovery have we seen food stamp usage remain at a peak?


We also have over 53,000,000 Americans receiving Social Security, a number that will only expand with demographic trends. The economy as always is a big complicated machine but one thing has emerged in the last few decades:
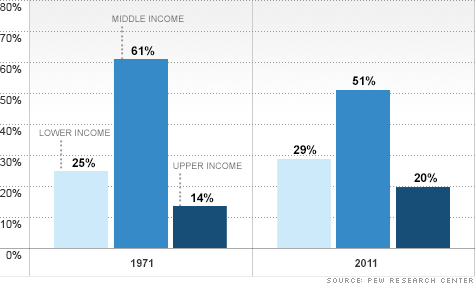
-Those at the bottom have increased as a percentage-The middle has been hollowed out-A few more have trickled into the higher income category
What does this chart tell us? We have a large number of Americans falling in the low income category. The middle class has been squeezed. Those earning higher incomes have also increased reflecting an economy favoring very specialized high income training (i.e., doctors, engineers, scientist, etc). Looking at the data we have to ask whether there are any policies that can help in broadening the middle class. It is unlikely given that the majority of new jobs are lower wage jobs and the expansion in more technical jobs do carry higher wage levels but these jobs as a ratio of total jobs is limited. It also helps to explain the high structural rate of unemployment.
In sum, when you hear middle class remember this:
The middle point for household income is at $50,000 (Source: Census ACS)If your household makes more than $100,000 you are in the top 20 percent of householdsThe average per capita wage in the US is $26,000 (Source: Social Security wage data)
If you are calling something the middle make sure you understand some math terminology. I’m sure the media would love to keep people in the dark so they can keep spending money as if they were part of the top tier of income earners.


No comments:
Post a Comment