What a year 2012 has been! The mainstream media continues to tell us what a “great job” the Obama administration and the Federal Reserve are doing of managing the economy, but meanwhile things just continue to get even worse for the poor and the middle class. It is imperative that we educate the American people about the true condition of our economy and about why all of this is happening. If nothing is done, our debt problems will continue to get worse, millions of jobs will continue to leave the country, small businesses will continue to be suffocated, the middle class will continue to collapse, and poverty in the United States will continue to explode. Just “tweaking” things slightly is not going to fix our economy. We need a fundamental change in direction. Right now we are living in a bubble of debt-fueled false prosperity that allows us to continue to consume far more wealth than we produce, but when that bubble bursts we are going to experience the most painful economic “adjustment” that America has ever gone through. We need to be able to explain to our fellow Americans what is coming, why it is coming and what needs to be done. Hopefully the crazy economic numbers that I have included in this article will be shocking enough to wake some people up.
The end of the year is a time when people tend to gather with family and friends more than they do during the rest of the year. Hopefully many of you will use the list below as a tool to help start some conversations about the coming economic collapse with your loved ones. Sadly, most Americans still tend to doubt that we are heading into economic oblivion. So if you have someone among your family and friends that believes that everything is going to be “just fine”, just show them these numbers. They are a good summary of the problems that the U.S. economy is currently facing.
The following are 50 economic numbers from 2012 that are almost too crazy to believe…
#1 In December 2008, 31.6 million Americans were on food stamps. Today, a new all-time record of 47.7 million Americans are on food stamps. That number has increased by more than 50 percent over the past four years, and yet the mainstream media still has the gall to insist that “things are getting better”.
#2 Back in the 1970s, about one out of every 50 Americans was on food stamps. Today, about one out of every 6.5 Americans is on food stamps.
#3 According to one calculation, the number of Americans on food stamps now exceeds the combined populations of “Alaska, Arkansas, Connecticut, Delaware, District of Columbia, Hawaii, Idaho, Iowa, Kansas, Maine, Mississippi, Montana, Nebraska, Nevada, New Hampshire, New Mexico, North Dakota, Oklahoma, Oregon, Rhode Island, South Dakota, Utah, Vermont, West Virginia, and Wyoming.”
#4 According to one recent survey, 55 percent of all Americans have received money from a safety net program run by the federal government at some point in their lives.
#5 For the first time ever, more than a millionpublic school students in the United States are homeless. That number has risen by 57 percentsince the 2006-2007 school year.
#6 Median household income in the U.S. has fallen for four consecutive years. Overall, it has declined by over $4000 during that time span.
#7 Families that have a head of household under the age of 30 have a poverty rate of 37 percent.
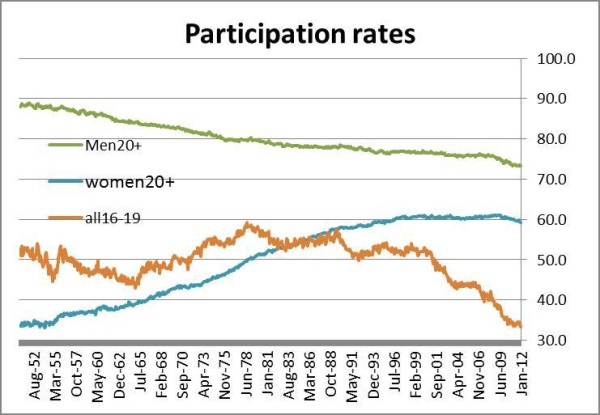
#8 The percentage of working age Americans with a job has been under 59 percent for 39 months in a row.
#9 In September 2009, during the depths of the last economic crisis, 58.7 percent of all working age Americans were employed. In November 2012, 58.7 percent of all working age Americans were employed. It is more then 3 years later, and we are in the exact same place.
#10 When you total up all working age Americans that do not have a job in America today, it comes to more than 100 million.
#11 According to one recent survey, 55 percent of all small business owners in America “say they would not start a business today given what they know now and in the current environment.”
#12 The number of jobs at new small businesses continues to decline. According to economist Tim Kane, the following is how the decline in the number of startup jobs per 1000 Americans breaks down by presidential administration…
Bush Sr.: 11.3
Clinton: 11.2
Bush Jr.: 10.8
Obama: 7.8
#13 The U.S. share of global GDP has fallen from 31.8 percent in 2001 to 21.6 percent in 2011.
#14 The United States has fallen in the global economic competitiveness rankings compiled by the World Economic Forum for four years in a row.
#15 There are four major U.S. banks that each have more than 40 trillion dollars of exposure to derivatives.
#16 In 2000, there were more than 17 million Americans working in manufacturing, but now there are less than 12 million.
#17 According to the Pew Research Center, 61 percent of all Americans were “middle income” back in 1971. Today, only 51 percent of all Americans are.
#18 The Pew Research Center has also found that 85 percent of all middle class Americans say that it is harder to maintain a middle class standard of living today than it was 10 years ago.
#19 62 percent of all middle class Americans say that they have had to reduce household spendingover the past year.
#20 Right now, approximately 48 percent of all Americans are either considered to be “low income” or are living in poverty.


