Genetic Engineering: The Global Food and Agricultural Crisis

Global Research
July 12, 2013

gmfood
In 2012, Professsor Seralini of the University of Caen in France led a team that carried out research into the health impacts on rats fed GMOs (genetically modified organisms) (1). The two-year long study concluded that rats fed GMOs experienced serious health problems compared to those fed non GM food. Now comes a new major peer-reviewed study that has appeared in another respected journal. This study throws into question the claim often forwarded by the biotech sector that GMO technology increases production and is beneficial to agriculture.
Researchers at the University of Canterbury in the UK have found that the GM strategy used in North American staple crop production is limiting yields and increasing pesticide use compared to non-GM farming in Western Europe. Led by Professor Jack Heinemann, the study’s findings have been published in the June edition of the International Journal of Agricultural Sustainability (2). The research analysed data on agricultural productivity in North America and Western Europe over the last 50 years. 
Heinemann states his team found that the combination of non-GM seed and management practices used by Western Europe is increasing corn yields faster than the use of the GM-led package chosen by the US. The research showed rapeseed (canola) yields increasing faster in Europe without GM than in the GM-led package chosen by Canada. What is more, the study finds that it is decreasing chemical herbicide and achieving even larger declines in insecticide use without sacrificing yield gains, while chemical herbicide use in the US has increased with GM seed.
According to Heinemann, Europe has learned to grow more food per hectare and use fewer chemicals in the process. On the other hand, the US choices in biotechnology are causing it to fall behind Europe in productivity and sustainability.
The Heinemann team’s report notes that incentives in North America are leading to a reliance on GM seeds and management practices that are inferior to those being adopted under the incentive systems in Europe. This is also affecting non GM crops. US yield in non-GM wheat is falling further behind Europe, “demonstrating that American choices in biotechnology penalise both GM and non-GM crop types relative to Europe,” according to Professor Heinemann.
He goes on to state that the decrease in annual variation in yield suggests that Europe has a superior combination of seed and crop management technology and is better suited to withstand weather variations. This is important because annual variations cause price speculations that can drive hundreds of millions of people into food poverty.

Amnesty's price: $12,433 for every legalized immigrant household

Washington Examiner
July 12, 2013


White House Propaganda Video

A fight has erupted over the costs of granting amnesty to the estimated 11 million illegal immigrants in America, with the White House claiming the cash benefits to the Treasury are huge and will slash the deficit, and critics showing it will cost Americans more and increase the deficit.
The White House late Thursday dispatched an email to President Obama's campaign supporters that provided a video claiming that immigration reform will result in a 5.4 percent growth in GDP as "highly skilled" workers and "entrepreneurs" add to the country's economic base. No mention was made of low-skilled workers, the bulk of illegal immigrants in the country.
"Here's one of the best things about immigration reform: It's going to make our economy a lot stronger," said the White House. "Not enough people are talking about the economic benefits of immigration reform, but it's exactly the conversation that will help us win the national debate on this issue."

Critics are pushing back hard, led by the Heritage Foundation. Among the key points: reform supporters suggest that immigrants will suddenly be paying taxes when they become legal, but that's already happening.
Heritage is highlighting a chart that details the taxes paid and government services received by all Americans, including illegal immigrants. It shows that after amnesty, immigrants will cost governments $12,433 in benefits over the taxes they pay per year. Over a lifetime of an adult illegal granted amnesty, the difference between benefits received and taxes paid would be a cost to taxpayers of $592,000.

President Barack Obama orders federal employees to report suspicious actions of their colleagues

McClatchy News
July 10, 2013


In an initiative aimed at rooting out future leakers and other security violators, President Barack Obama has ordered federal employees to report suspicious actions of their colleagues based on behavioral profiling techniques that are not scientifically proven to work, according to experts and government documents.
The techniques are a key pillar of the Insider Threat Program, an unprecedented government-wide crackdown under which millions of federal bureaucrats and contractors must watch out for “high-risk persons or behaviors” among co-workers. Those who fail to report them could face penalties, including criminal charges.
Obama mandated the program in an October 2011 executive order after Army Pfc. Bradley Manning downloaded hundreds of thousands of documents from a classified computer network and gave them to WikiLeaks, the anti-government secrecy group. The order covers virtually every federal department and agency, including the Peace Corps, the Department of Education and others not directly involved in national security.
Under the program, which is being implemented with little public attention, security investigations can be launched when government employees showing “indicators of insider threat behavior” are reported by co-workers, according to previously undisclosed administration documents obtained by McClatchy. Investigations also can be triggered when “suspicious user behavior” is detected by computer network monitoring and reported to “insider threat personnel.”
Federal employees and contractors are asked to pay particular attention to the lifestyles, attitudes and behaviors – like financial troubles, odd working hours or unexplained travel – of co-workers as a way to predict whether they might do “harm to the United States.” Managers of special insider threat offices will have “regular, timely, and, if possible, electronic, access” to employees’ personnel, payroll, disciplinary and “personal contact” files, as well as records of their use of classified and unclassified computer networks, polygraph results, travel reports and financial disclosure forms.


Read more here: http://www.mcclatchydc.com/2013/07/09/196211/linchpin-for-obamas-plan-to-predict.html#.Ud1xbDu1GSo#storylink=cpy

How much do Americans earn? How the other half lives and examining income growth and median income for US households in 2013.

MyBudget360
July 10, 2013

How much do Americans earn?  Such an important and pivotal question is rarely examined in the mainstream press.  It almost appears to be a forbidden topic of discussion.  You would think that this question would warrant deeper examination given that income is the driving force of our consumer hungry economy.  Yet many people are driven to spend money they don’t have regardless of income because of the booming debt market.  Household income growth is the critical issue when it comes to maintaining a vibrant middle class.  You rarely get a straight answer when it comes to income growth because talking about incomes is taboo and actually is offensive in real life.  Try asking someone how much they make at a party and find out how quickly unpopular you will become.  Yet the data is frigid and cold but tells us many things about our economy.  What Americans earn sheds a deeper perspective as to how well households are doing in the current economy.  So how much do Americans earn at this stage in this so-called economic recovery?
US Household Income
us-household-income
Source:  Census, ACS
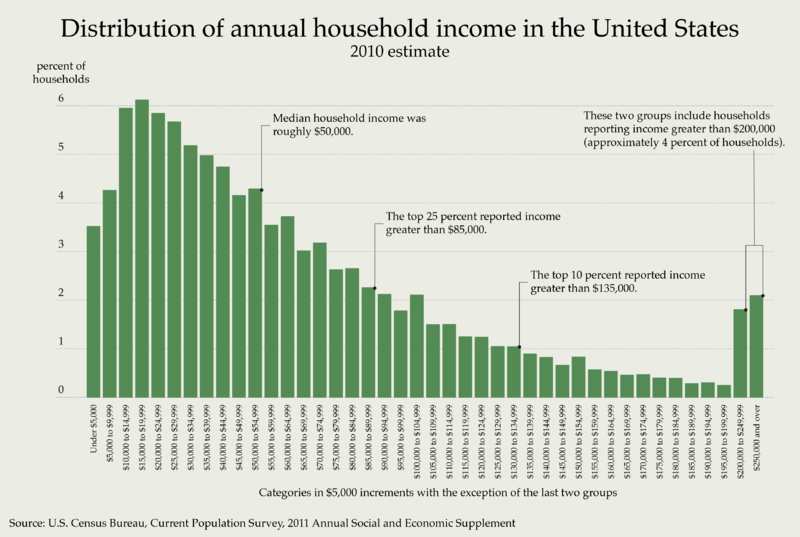
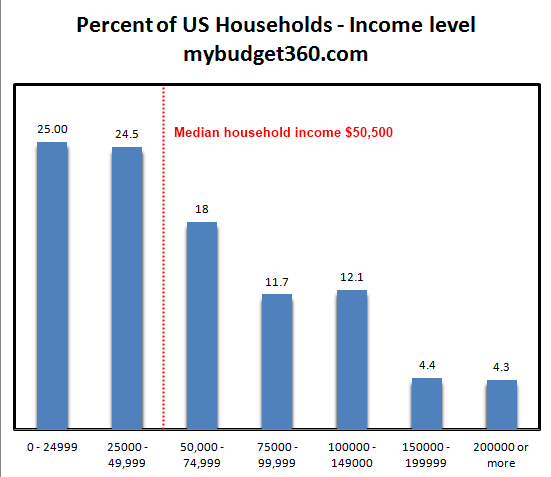
The best breakdown of income is from the US Census ACS data that breaks down household gross incomes.  The above chart is fairly clear.  The median household income in the US is $50,500 based on the latest data.  Given that this is the perfect splitting point of 114 million households, you get a better idea of how the other half is living here.
What is fascinating when we dig into Social Security records is that the average per capita wage is $26,000 so this lines up nicely with the predominant two-income household trend we have been seeing over the last few decades.  What I find intriguing however is that most regular television ads seem to cater to the idea that every family is making more than $100,000.  If you look above, only about 20 percent of all US households make that much.  This is why we are in the massive debt problem that we currently have.  We as a nation and at a family level are spending way beyond our means simply by going into massive debt.
Looking at the income distribution in another light might be helpful:
household income distribution
Looked at from a different perspective, we realize how rare it is for households to make more than $100,000.  I always find it fascinating when you have pundits come on TV and act as if $150,000 is middle class.  Look at the raw data.  Unless the definition of middle has changed, the middle is now $50,000.  Instead of arguing that $150,000 is little, they should be discussing why income growth for most of the country has gone cold in the midst of a recovery.  Also, we have over 47 million Americans on food stamps.  These are the families at the other side of the income chart.
Real Income Growth
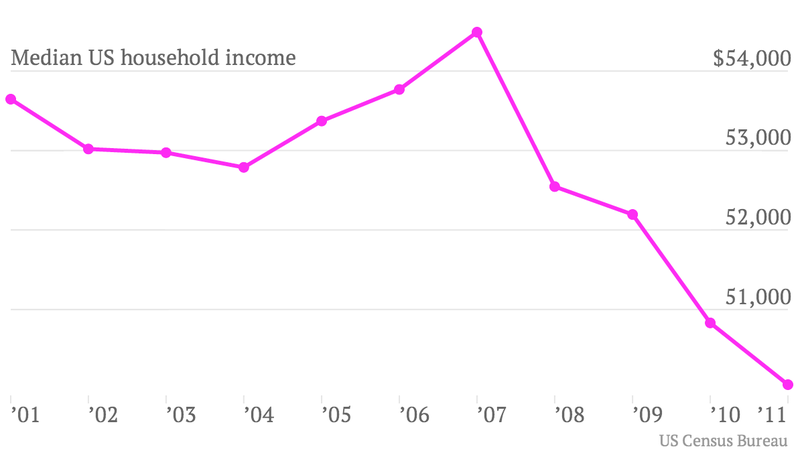
So what has happened to income growth over the last decade?
Median_US_household_income
The real median US household income is now down to levels last seen in 1995.  For most people, income growth has been virtually non-existent.  In real terms, most families are in a financially tougher position than they were in the mid-1990s.
The peak above is somewhat deceptive however.  In 2007, the peak was reached by a massive debt induced bubble and many tied to this bubble where making inflated wages (similar to the tech boom where simply putting up a website nearly entitled some to million dollar paydays).
Inflation is a sinister beast when it comes to income growth.  If inflation is outpacing wage growth, we get what we are seeing in the charts above.  Your purchasing power erodes and then people wonder why it costs so much to go to college, buy a car, or even a home.
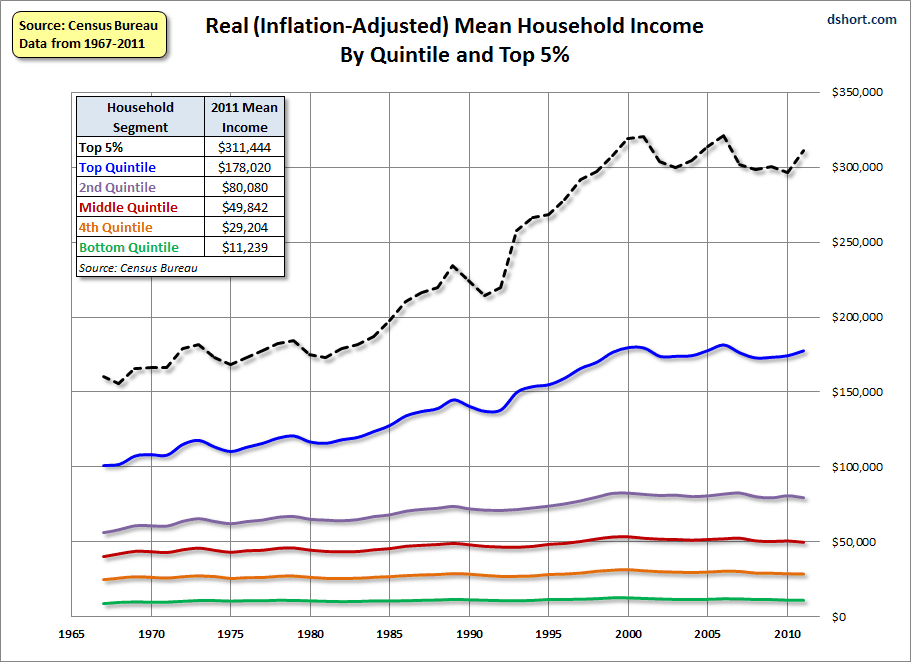
When we adjust for inflation, we see that real income growth only occurred for a small portion of families:
household-incomes-mean-real
Over the last couple of decades, you would have to be in the top quintile of household incomes to see some true growth.  The top five percent have done exceptionally well but that is only a tiny portion of our country.
Yet if you look at the other 80 percent of households, income growth has flat-lined.
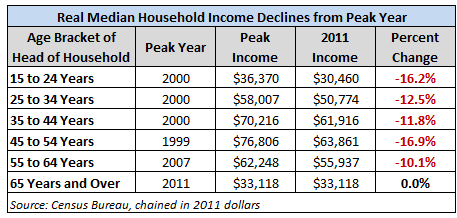
If we break up income growth by age brackets, we also see that younger Americans have taken it particularly hard:
real median income
Source:  Dshort
What the above chart doesn’t reflect is the amount of debt that is saddled on young Americans since the cost of going to college since 2000 has gone on a ridiculous bender.  From 2000 to the present, total student debt went from $200 billion to over $1 trillion becoming the second largest consumer debt market only behind mortgage debt.
Economy and Income
So you might be asking how can Americans spend at these levels if incomes are back to 1995 levels:
us-debt-and-gdp
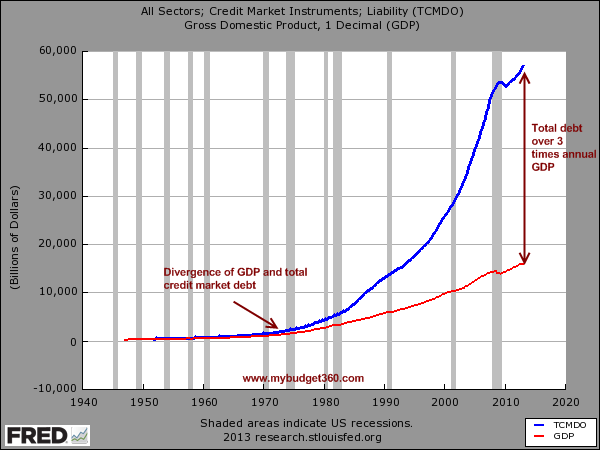
This is the answer.  While incomes are stuck, debt has massively expanded.  The total debt market is now over 3 times the size of our annual GDP.  Since the crisis hit in 2007, households have been in a process of deleveraging but thanks to low rates, Wall Street and large financial institutions are back to speculating in the markets and injecting tons of digitally printed money back into the economy.  Yet as we have seen with household income data, very little has trickled down to regular families and most of the gains remained at the top.
How much do Americans earn?  The numbers are rather clear.  The typical US household makes $50,500.  With even our modest headline inflation number (of course the CPI understates other items like college debt and home prices) this is problematic because wages are simply not growing.  The above income figures reflect a primary reason why most Americans don’t feel this as a recovery.

101M Get Food Aid from Federal Gov’t; Outnumber Full-Time Private Sector Workers

CNS News
July 8, 2013

food stamps
(AP File Photo)
(CNSNews.com) – The number of Americans receiving subsidized food assistance from the federal government has risen to 101 million, representing roughly a third of the U.S. population.
The U.S. Department of Agriculture estimates that a total of 101,000,000 people currently participate in at least one of the 15 food programs offered by the agency, at a cost of $114 billion in fiscal year 2012.
That means the number of Americans receiving food assistance has surpassed the number of full-time private sector workers in the U.S.
According to the Bureau of Labor Statistics (BLS), there were 97,180,000 full-time private sector workers in 2012.
The population of the U.S. is 316.2 million people, meaning nearly a third of Americans receive food aid from the government.
Of the 101 million receiving food benefits, a record 47 million Americans participated in the Supplemental Nutrition Assistance Program (SNAP), commonly known as food stamps. The USDA describes SNAP as the “largest program in the domestic hunger safety net.”
The USDA says the number of Americans on food stamps is a “historically high figure that has risen with the economic downturn.”
SNAP has a monthly average of 46.7 million participants, or 22.5 million households.  Food stamps alone had a budget of $88.6 billion in FY 2012.
The USDA also offers nutrition assistance for pregnant women, school children and seniors.
The National School Lunch program provides 32 million students with low-cost or no-cost meals daily; 10.6 million participate in the School Breakfast Program; and 8.9 million receive benefits from the Woman, Infants and Children (WIC) program each month, the latter designed for low-income pregnant, breastfeeding, and postpartum women, as well as children younger than 5 years old.
In addition, 3.3 million children at day care centers receive snacks through the Child and Adult Care Food Program.
There’s also a Special Milk Program for schools and a Summer Food Service Program, through which 2.3 million children received aid in July 2011 during summer vacation.
At farmer’s markets, 864,000 seniors receive benefits to purchase food and 1.9 million women and children use coupons from the program.
A “potential for overlap” exists with the many food programs offered by the USDA, allowing participants to have more than their daily food needs subsidized completely by the federal government.
According to a July 3 audit by the Inspector General, the USDA’s Food Nutrition Service (FNS) “may be duplicating its efforts by providing participants total benefits in excess of 100 percent of daily nutritional needs when households and/or individuals participate in more than one FNS program simultaneously.”
Food assistance programs are designed to be a “safety net,” the IG said.
“With the growing rate of food insecurity among U.S. households and significant pressures on the Federal budget, it is important to understand how food assistance programs complement one another as a safety net, and how services from these 15 individual programs may be inefficient, due to overlap and duplication,” the audit said.

Bush & Cheney Knew About 9/11 Months Before It Happened Says Whistle Blower Charged under Patriot Act

RT News
July 2, 2013

US President Barack Obama quietly signed his name to an Executive Order on Friday, allowing the White House to control all private communications in the country in the name of national security

12160.info
July 6, 2013

Executive Order -- Assignment of National Security and Emergency Preparedness Communications Functions
July 6, 2013
US President Barack Obama quietly signed his name to an Executive Order on Friday, allowing the White House to control all private communications in the country in the name of national security.
President Obama released his latest Executive Order on Friday, July 6, a 2,205-word statement offered as the “Assignment of National Security and Emergency Preparedness Communications Functions.” And although the president chose not to commemorate the signing with much fanfare, the powers he provides to himself and the federal government under the latest order are among the most far-reaching yet of any of his executive decisions.

Pentagon Behind Egypt Military Coup: Michel Chossudovsky

Press TV
July 7, 2013

Michel Chossudovsky claims the Pentagon is behind the recent Coup in Egypt.