February 23, 2014
Inflation has a subtle eroding effect that impacts entire economies. In the United States, we have been fortunate to have relatively stable rates of inflation for two generations. Even in times of high inflation like the 1970s, people were able to adjust unlike places that experience uncontrolled inflation like Argentina is currently facing. Also, wages rose in tandem which helped buffer the pain of higher costs. Today however, inflation has eroded the purchasing power of the middle class. Only when we look at longer periods of time do we see the large impact inflation has on our ability to buy real goods and services. People found a piece comparing 1938 and 2013 prices on various goods and items to be enlightening. Since our middle class did not fully emerge until the end of World War II, it might be useful to compare the price of items back from 1950 to where things stand today. Has inflation had a big impact on our purchasing power since 1950?
1950 living versus that of 2014
It might be useful to first look at a few common items from 1950:
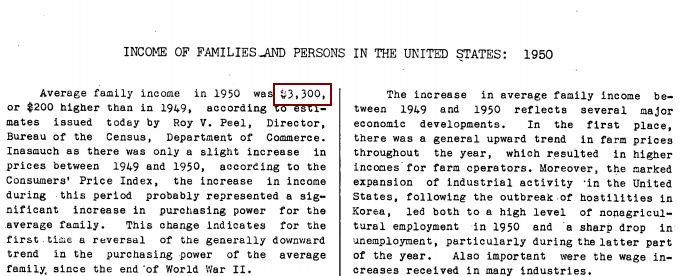
The average family income: $3,300The average car cost: $1,510The median home price: $7,354
These are three very important metrics when it comes to measuring purchasing power in the United States. Since we consider having a car and a home as cornerstones to a middle class lifestyle, it is useful to look at these figures since we can easily grab these figures from reliable sources.
See below for source data:
Source: US Department of Commerce
Then we can see the median home price:
Source: US Census
A Ford car could be had with a price range of $1,339 to $2,262 depending on the model. Income is an important measure because it gives us an insight into how well families are doing and how much money is being spent on certain items. So let us derive ratios for each of the items for the 1950s:
Home price / income = 2.2Car cost / income = .45
This is important here. The typical home cost 2.2 times annual income while a car cost .45 times annual income. Let us now fast forward to 2014 and see where these things stand:
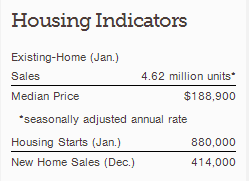
The average family income: $51,017The average car cost: $31,252The median home price: $188,900
Let us show the data here:
Source: National Association of Realtors
Household income was pulled from Census data based on what the typical household earns. Inflation has a subtle way of eroding purchasing power. Let us pull some ratios here:
Home price / income = 3.7Car cost / income = .61
Housing has gotten dramatically more expensive. The cost of a new car has gone up but not so noticeably when looking at inflation data. Inflation has largely eaten away at income on other fronts like college tuition and healthcare. These were much more affordable back in the 1950s relative to overall income.
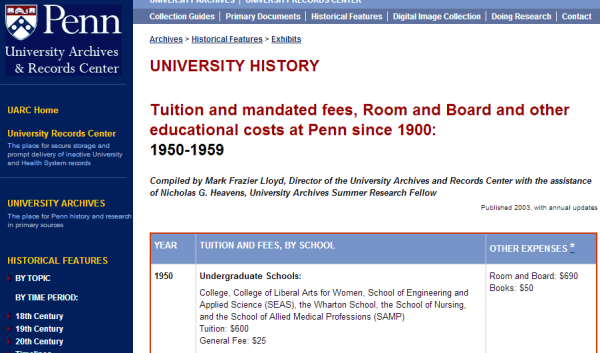
For example, in 1950 at the University of Pennsylvania annual tuition was $600:
We should run a ratio here as well:
Tuition / income = .18
Let us look at current tuition costs:
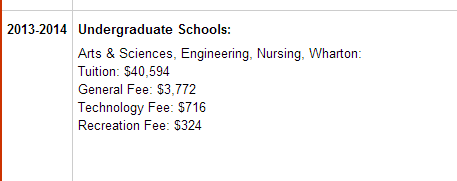
Current tuition is over $40,000 per year.
Tuition / income = .79
This is a massive change. In 1950, a family sending their child to the University of Pennsylvania would only spend 18 percent of their annual income (if they paid in cash) to send their kid to study. Today it would consume 79 percent of gross annual income. Even if we look at net take home pay a regular family in no way could send their child to school without going into massive student debt.
A good portion of inflation over this time has been masked by massive amounts of debt and financing. Car purchases, mortgages, and college are now financed long-term. Low rateshave masked this erosion but with rates reaching the lower bound of the range, the pain of inflation is now being felt by many households.


No comments:
Post a Comment