December 31, 2012
With talk of the fiscal cliff taking up most of the headlines it is probably useful to look at income figures for Americans. The media rarely discusses income because it is a touchy subject. It probably would not be savvy in a marketing sense to tell viewers that their incomes have been stuck in the financial mud for well over a decade. Household incomes in the US have been stagnant for well over a decade. Real income growth has largely occurred in the top 10 percent of US households. This is why we are seeing the middle class shrink in our nation. Over 47 million Americans now rely on food stamps. It would be useful if all this talk about the fiscal cliff actually examined the nuts and bolts of US household income.
US median and average household incomes
First we should examine some data from the latest Census figures:
Source: US Census
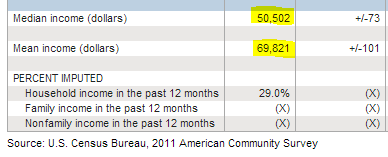
The median household income in the US is $50,502. This is some extremely useful data given that it is exploring over 114 million US households. If you want to know how most Americans are living this is a good figure to base your assumptions. $50,000 does not go a long way in our economy today given the cost of food, energy, housing, education, and healthcare.
The average US income is a less useful measure because it is skewed by high income households and mega income earners. According to Social Security tax records for 2011 you have 93 Americans making more than $50,000,000 with average earnings of $79,000,000+. Clearly this pushes the average much higher and that is why you see the average household income at $69,821.
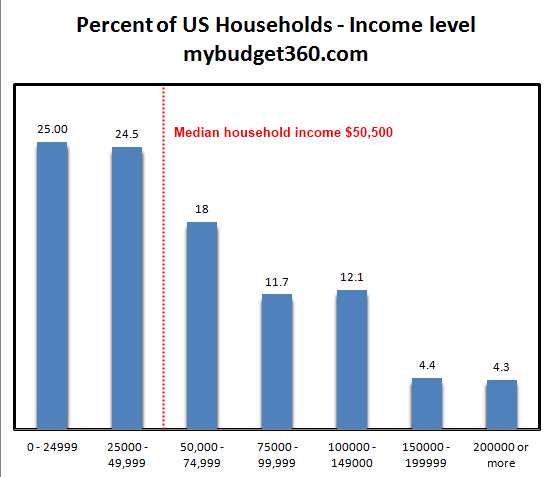
Breaking down US household income by category presents a clearer picture:
Source: US Census
20.8 percent of US households make $100,000 or more. Only 4.3 percent make more than $200,000 and roughly 2 percent make more than $250,000. Given all the ads you see on network TV you would think that every other US household was pulling in $200,000 a year given the kind of products that are pushed. Of course most of the goods bought in the last decade were financed with massive debt and not actual saved wealth.
Where did income grow?
US income growth has been absent for most households. In fact, over the last four decades most of the real income growth has occurred for the top 10 percent of US households:
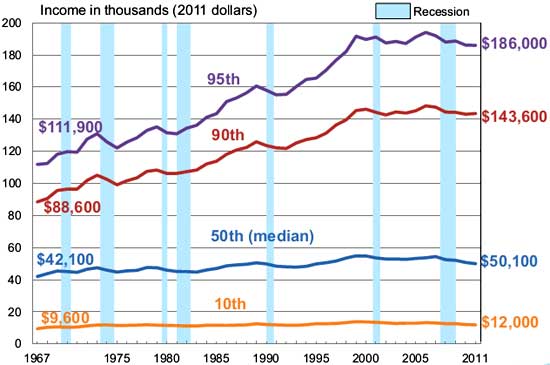
The typical family barely saw any real income growth and that is why many feel a true pinch to their wallet. Yet household incomes for earners in the top 10 percent saw real sizeable growth over the last four decades.
I’m not sure if Americans are fully aware of these income figures. Let us look at some data from the Social Security Administration:

According to Social Security tax records for 2011:
151,380,749 wage earners (had earnings in 2011)50 percent of US wage earners made less than or equal to the median wage, estimate to be $26,96566 percent of US wage earners made less than or equal to $41,211.36
This information is at a granular level but extremely helpful. Since everyone pays into the Social Security system, this is a good sense of how many people are earning income in the US. According to this information 151 million Americans earned some sort of wages or compensation in 2011. The median wage in the US per person is $26,695. This tells us a lot since the median household income is at $50,500. Since the Census data looks at households, this data hones in on individual wage earners. 66 percent of Americans earn less than $41,212.
It is important to understand the income breakdown in the US before fully appreciating the fiscal cliff talks. After all, the biggest driving force for most Americans is their paycheck so it pays to understand this data fully.

No comments:
Post a Comment