Showing posts with label economic collapse. Show all posts

Cyberattack Forces Shutdown Of Largest Gasoline Pipeline In United States

 Zero Hedge

May 7, 2021


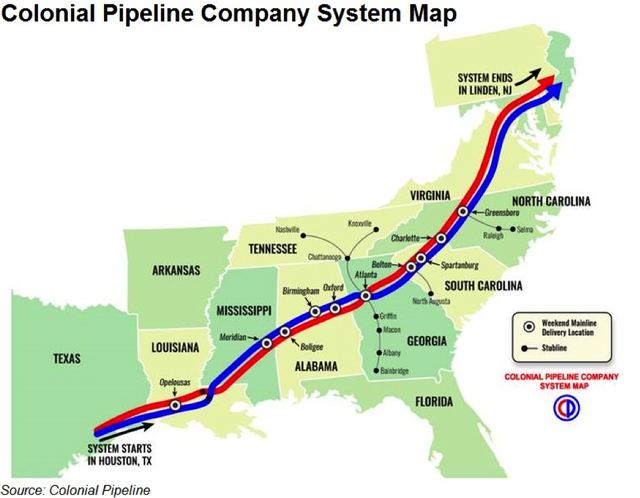
The largest gasoline pipeline on the East Coast, and the US in general, was shut down on Friday after its operator struggled to contain a cyberattack which threatened its systems. The 5,500-mile Colonial Pipeline, which is the single largest refined-products pipeline in the United States, halted transit as the company was forced to take "certain systems offline to contain the threat, which has temporarily halted all pipeline operations," according to The Wall Street Journal on Saturday. It's reportedly still offline into early Saturday.

Colonial Pipeline System

Colonial's network is responsible for supplying fuel that originates with refiners on the Gulf Coast to most of the eastern and southern US, accounting for over 2.5 million barrels per day in gasoline, diesel, and jet fuel, or other refined products transferred, making up 45% of all the East Coast's fuel supply. It spans from Texas through southern states and up to New Jersey.

"At this time, our primary focus is the safe and efficient restoration of our service and our efforts to return to normal operation," the Alpharetta, Georgia-based company stated. "This process is already underway, and we are working diligently to address this matter and to minimize disruption to our customers."

Read the entire article

China Warns Of Possible Armed Conflict With US Over Coronavirus Backlash

Zero Hedge
May 4, 2020

An internal report presented to Chinese President Xi Jinping and other top leaders concludes that global anti-China sentiment is at a level not seen since the 1989 Tiananmen Square crackdown, and recommends preparing for a worst-case scenario of armed conflict with the United States, according to Reuters, citing people familiar with the content of the document.

The report, created by the China Institutes of Contemporary Internal Relations (CICIR) - which is affiliated with the Ministry of State Security - suggests that the wave of anti-China sentiment is led by the United States, which sees China's rise as a global superpower as a threat to Western democracies.

One of those with knowledge of the report said it was regarded by some in the Chinese intelligence community as China’s version of the “Novikov Telegram”, a 1946 dispatch by the Soviet ambassador to Washington, Nikolai Novikov, that stressed the dangers of U.S. economic and military ambition in the wake of World War Two.
Novikov’s missive was a response to U.S. diplomat George Kennan’s “Long Telegram” from Moscow that said the Soviet Union did not see the possibility for peaceful coexistence with the West, and that containment was the best long-term strategy. -Reuters
 Reuters, which hasn't seen the paper, couldn't determine to what extent the report's grim outlook reflects positions held by China's state leaders, nor how much it might influence policy. That said, it suggests Beijing is taking the threat of global backlash over the coronavirus pandemic - which Western intelligence agencies suspect originated at a Wuhan biolab which was experimenting with bat coronavirus, and had previous concerns raised over the pandemic potential of such research.
China's early coverup of the outbreak - including silencing and/or disappearing whistleblowing doctors and journalists, lying about the transmissibility of the virus while hoarding personal protective equipment (PPE), quarantining Wuhan domestically while allowing international travel, and using the World Health Organization to run cover - has drawn global scorn as COVID has infected over 3.5 million and killed nearly 250,000 in five months.

Hundreds Of Tankers Amid 2020 Oil Industry Collapse Are Stopped

Epic Economist
April 28, 2020


The economic collapse is happening in a worldwide proportion. The dollar is operating high, and the stock markets are crashing, and even temporarily suspending trading in some countries. This is happening due to a price war in the international oil market, led by Russia and Saudi Arabia, causing a sudden oil price crash.
Read the entire transcript here

Venezuela’s Socialist Hyperinflation Turned People Back To Barter System

Mac Slavo
SHTFplan.com
July 12, 2018

In the wake of socialist Venezuela’s massive hyperinflation, citizens have returned to the original monetary system in order to survive.  The barter system is now prevalent in the collapsed economy of the authoritarian dictator, Nicolas Maduro.
Barter is one of the best ways to trade goods, considering its almost impossible to tax those transactions and since money in Venezuela is as difficult to come by as food and medicine, that’s now the preferred method of trading goods and services. Women in Venezuela have been turning to prostitution and asking for payment in food instead of cash for a while now, and as the regime tightens its grip on the private sector, more will have to turn to trade to survive.
Once the richest country of Latin America, Venezuela, which sits on world’s largest oil reserves, now has a bleak future. People in this oil-rich country are scrambling for money, food and basic necessities. They have taken to swapping different items and even doing chores in exchange for packages of flour, rice, and cooking oil.
“There is no cash here, only barter,” said Mileidy Lovera, who is a 30-year-old mother of four. Lovera spoke with Economic Times while hoping to trade a cooler of fish that her husband had caught for food to feed her children or medicine for her son who has epilepsy.
Venezuela has experienced the death of cash. Payment for even the cheapest of goods and services would require unwieldy piles of banknotes or fiat currency, and there simply are not enough of those in circulation.  While wealthy formal businesses in cities can get by on bank transfers and debit cards, such operations are largely out of the question in rural areas.
The economic collapse, which began under socialist President Nicolas Maduro’s government, has driven nearly one million people to migrate to other places in search of food, medicine, or other basic life necessities. Others have stayed and fight each other with machetes for some “quality garbage” that is thrown out.
Economists have even begun placing the blame on the current government – a socialist regime which actually leans more towards communism (and the two are almost the same thing anyway). Many economists say the central bank has not printed bills fast enough to keep up with inflation, which according to the opposition-run congress, reached an annual rate of almost 25,000 percent in May.  “It’s a very primitive payment system but it’s also very primitive for a country not to have enough cash available,” said Luis Vicente Leon, an economist.

Mancession: Men lost 2 times more jobs than women from the Great Recession and have gained half as many jobs since late 2007.

MyBudget360
April 9, 2016

It should be clear that the Great Recession took a toll on most people.  This is reflected in household incomes and savings.  But one thing that is abundantly clear is that the Great Recession took a massive toll on male employment at a rate twice that of females.  We’ll get into the charts and figures later in the article but suffice it to say that the recession didn’t hurt people equally.  Some took on the brunt of the damage.  When splitting out job losses and gains by gender, it is clear that something else was going on.  One reason for this has to do with the big losses in construction and manufacturing that tend to be heavily dominated by men.  Thehousing bubble imploding didn’t help in this respect.  In many ways this has been a Mancession even in the midst of a recovery that started in early 2009.
Mancession – men haven’t recovered from Great Recession
One of the more interesting points of reference is looking at total jobs lost and gained since the Great Recession hit but splitting out men and women.  Let us look at the figures:
Men lost 5.7 million jobs and women lost 2.6 million jobs.  Since late 2007 men have gained 904,000 jobs and women have gained 1,858,000 jobs (twice the rate of men).  So for nearly a decade, women are netting jobs at twice the rate of men.
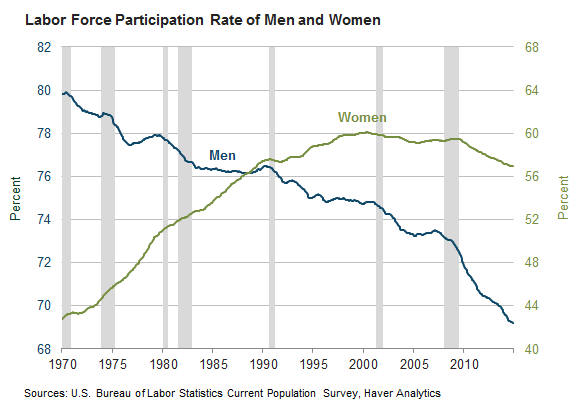
This might be shrugged off as a temporary change but there is something bigger going on.  Just look at the participation rate of men in the labor force:
LFPD_chart08
The participation rate of men in the labor force has been falling dramatically since the 1970s.  Women’s participation rate was moving up into the 2000s but has also moved into a similar trajectory.

Job Growth Doesn’t Mean We’re Getting Richer

Mises.org
March 27, 2016

In response to recent claims by the Obama administration and others that “millions of jobs” have recently been created, I examined the data here at mises.org to see if the claims were true. It turns out that job growth since the 2008 recession has actually been quite weak, and hardly something to boast about.
Nevertheless, our conclusions from these analyses tend to rest on the idea that job growth is synonymous with gains in wealth and economic prosperity.
But is that a good assumption?
In an unhampered market, the answer would be no, for several reasons.
First of all, as worker productivity increases, workers would need to work fewer hours to maintain their standard of living.
Second, as goods become less expensive (as a result of rising productivity) it would also be necessary to work fewer hours to maintain the same standard of living.
This need for fewer man-hours could translate into shorter work weeks and shorter days, but it could also manifest itself at the household level in the form of changes from two-income households to one-income households. Or, people may retire earlier, thus leaving the work force.
In other words, in a well-functioning economy over time, less human labor will be necessary to maintain standards of living, all things being equal. (If consumers wish to constantly increase their standard of living of course, they will choose more labor over more leisure for the sake of more consumption.)

Historical Trends in Work Hours

Even in our hampered and un-free economy, we can still see this basic trend at work. The number of work hours necessary to maintain the standard of living our grandparents enjoyed, for example, is less today than it was in 1950.
If middle-class consumers were satisfied with a two-bedroom residence in an unstylish neighborhood, one car, a single phone line, no air conditioning, and no internet access, many of them would require far fewer work hours than is necessary to maintain a common middle-class standard of living today.
In the 1950s for example, my mother shared a bedroom with three brothers in a two bedroom house in central Los Angeles. She went to a private Catholic school where there were 50 students to a classroom. For her family, there were certainly no European vacations or airline travel to seaside resorts.
And yet, no one would have described this lifestyle as “impoverished” or “lower class.” It was a middle-class lifestyle, but this lifestyle could only be maintained by far more than 40 hours of work at the family business each week, where both parents labored regularly.
This experience was not atypical.
In spite of increases in the standard of living since then, working hours have actually decreased. Indeed, according to Robert Fogel in The Fourth Great Awakening and the Future of Egalitarianism, from 1880 to 1995 the number of hours spent on work during an average day for a male head of household decreased from 8.5 hours to 4.7 hours. Meanwhile, leisure time increased from 1.8 hours to 5.8 hours.
In a separate study by Thomas Juster and Frank Stafford, it was found that from 1965 to 1981 in the United States, “market work” hours per week fell from 51.6 hours to 44 hours for men. For women, market work rose from 18.9 hours to 23.9 hours. We would expect an increase for women over this period as women began to take on “market work” at higher rates than before. This was for wage work only, though, and if we include “housework” we find that “total work” for women during this time period fell from 60.9 hours to 54.4 hours. Women exchanged some housework for market work over this period, but overall, the work hours decreased. Total work for men decreased also, from 63.1 hours to 57.8 hours. (Housework increased for men over this period.)
In yet another study by Mary Coleman and John Pencavel, average weekly hours worked fell for white men from 44.1 hours in 1940 to 42.9 hours in 1988. It fell for white women from 40.6 hours to 35.5 hours over the same period.
The typical standard of living increased over these periods, as the square footage of housing units increased, automobiles became more common, and amenities like telephones, washing machines, personal computers, and climate control became more common. The work itself also became less hazardous over this time period.

The housing bubble is getting ready to implode: The scariest chart in real estate shows an impending correction because you can’t afford to buy a home today.

MyBudget360
March 25, 2016


“Definition of economic bubble:  A market phenomenon characterized by surges in asset prices to levels significantly above the fundamental value of that asset.”  We are definitely in another housing bubble.  First, most Americans can’t afford to buy a home without utilizing artificially low interest rates and even then they are stretching their budgets like spandex.  Second, home prices are surging in the face of stagnant household incomes.  That is the biggest sign of a bubble.  The underlying asset in housing is moving up even though incomes are not.  So what is driving prices up?  Speculation, flipping, investors, and what we would categorize as fickle money.  This is the ultimate sign of a housing bubble.  Homeownership is near a generational low because most households are living month to month unable to buy.  If you want to see the housing bubble in one chart look no further.
The scariest chart in housing
Home prices are up a stunning 34 percent from 2012.  That is an incredible increase but this is not being driven by families buying homes.  It would also be different if household incomes were going up.  They are not.  Take a look at this chart:

This might even be scarier than the years before the last bubble.  Why?  Take a look at the chart. From 2002 to 2008 housing prices and incomes went up together (but of course home values were already on an upward trajectory).  The bubble hit and both home values and incomes went down.  All of this makes sense.  In 2012 housing prices and incomes went up.  But that jump in income only lasted a brief period.  Now, you have home prices surging 34 percent yet incomes are stagnant.  That is a big problem.
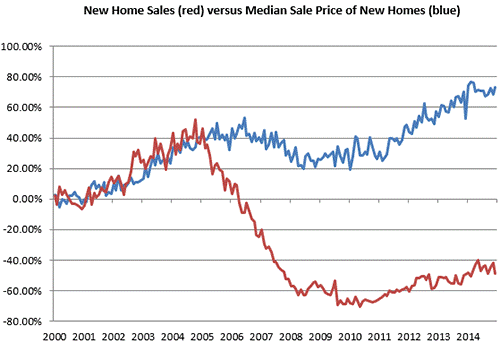
You can even see this problem between new home prices and new homes sold:
Chart2
New home sales are in the dumps yet prices are moving up dramatically.  Most of this is speculation and of course the financial sector in our economy is thriving on the backs of the middle class.  But are we in a bubble?
“Bubbles are often hard to detect in real time because there is disagreement over the fundamental value of the asset.”
This is where we stand today.  We are in the bubble.  It is hard to assess value because people are disagreeing on whether this is a bubble or not.  But take a look at commercial real estate values as well.  This is definitely a bubble.  You need to continue to have speculative money flowing in to keep values at their current levels.
Will the housing bubble pop this year?  Bubbles can last longer than most people think.  But there are already cracks in the system.  You saw the market briefly correcting this year.  Suddenly stocks are up on low volume and current prices are still overvalued.  The same can be said for housing.  Low supply, low demand, yet prices are going up.  The Fed is completely afraid to raise rates knowing that it has no other option but to keep rates low.  This policy move has made themiddle class a minority.
Here is a good summary of where we are going:
“(The Sovereign Investor) I see one of two scenarios at play. Which one do you think will ring true?
  • Homebuyers continue to fork over more dollars to buy properties while we sit with stagnant wage growth, stagnant economic growth and low-wage jobs being about all that’s created.
  • We are on the edge of a bubble larger than the one we experienced less than a decade ago as housing prices race back down to where it is affordable and sees demand from new buyers.
The Federal Reserve is held accountable for this fiasco. If it goes forward with a rate increase in the near future, it will be us who pay the price of another bubble.
There’s only one action to take if you ask me — lower your exposure to the industry.
In stocks, that’s homebuilders and mortgage originators. Avoid them at all costs. In your personal investments, that’s being prepared for another real estate shock.
These prices are unsustainable and due for a correction.
Once that happens, opportunity awaits you to pick up houses and housing-related stocks on the cheap.”
You have been warned.

Percent of Total Wealth Owned in the United States: Bottom 40% control -0.9% Meaning Close to Half the Country has a Negative Net Worth.

MyBuget360
February 20, 2016

Wealth is an important measure of financial stability and success.  Being able to have enough set aside for a rainy day can make the difference between weathering a minor storm to being in full upheaval because of an unexpected expense.  Most Americans however live paycheck to paycheck.  There is no emergency fund.  It is troubling to see new data looking at the distribution of wealth in the United States because many Americans actually have a negative net worth.  New data looking at wealth distribution highlights a growing gulf between Americans.  Wealth inequality like that seen during the Gilded Age and the Roaring 20s led to massive disequilibrium that ended up in deep financial corrections.  We are very much in a situation that rivals that period only this time the public is able to go into negative net worth territory through items like college loans, auto debt, and credit cards.  The percent of total wealth owned in the United States might surprise you.
Wealth in the United States
Wealth inequality is at record levels in the United States.  Most people don’t have a clue as to the percentage breakdown of wealth owned in the country.  New data released highlights a troubling scenario where the bottom 40 percent of Americans are actually in a negative net worth situation.
Take a look at the wealth breakdown here:

Source:  Harvard Gazette
“(Harvard Gazette) The details show that real wages for most U.S. workers have been relatively stagnant since the 1970s, while those for the top 1 percent have increased 156 percent, and those for the top 0.1 percent have increased 362 percent, according to a report by the Economic Policy Institute.
Those trends resulted in the poorest 20 percent of Americans receiving just 3.6 percent of the national income in 2014, down from 5.7 percent in 1974. The upper 20 percent, meanwhile, received nearly half of U.S. income in 2014, up from about 40 percent in 1974, according to Census Bureau statistics.”
This is what happens when wage growth disappears and inflation continues to expand.  To keep up the pretense that the middle class was thriving debt products allowed people to spend money they don’t have.  This is how the bottom 40 percent of Americans actually own negative wealth.  They simply have more debt than assets.
The story of the last financial crisis was one of too much debt.  As it happens, we have now surpassed that point once again:

The economy has been revived by more debt in the form of college loans, auto debt (subprime as well), housing debt, and credit card debt.  All of these debt sectors are up.  What the new data on wealth distribution highlights is that most of the wealth is controlled by the top 20 percent (88.9 percent of all U.S. wealth).  The distribution is getting more heavily tilted.
Many people realize that debt is not wealth but many don’t make the distinction.  If you buy a $30,000 car and finance the entire purchase, after one year it is likely that you will owe more on the car than it is worth.  Forget about the financing charges going to the lender.  Or taking on too much student loan debt.  These are all ways many people fall into a negative net worth trap.  In the end, the wealth distribution highlights one glaring fact: those at the top are controlling more and more wealth and we have also seen the middle class now become a minority.

Keiser Report: Moths to Economic Flames

Keiser Report
January 31, 2016


In this episode of the Keiser Report, Max Keiser and Stacy Herbert discuss moths to the flame as corporations, individuals and whole nations self-liquidate on the pyre of bad debts. They look at the incredibly shrinking benefits of massive Japanese money printing and also at the proposal that Western oil giants self-liquidate as the best means of deploying their capital in a newly free oil market where the marginal producer once again sets the price. In the second half, Max interviews economics writer and researcher, Chris Martenson of PeakProsperity.com, about his new book, Prosper: How to Prepare for the Future and Create a World Worth Inheriting. They define ‘prosperity’ and name the best ways to create it for yourself, despite any global trends working against it.


THIS 2 DAY STOCK MARKET CRASH WAS LARGER THAN ANY 1 DAY STOCK MARKET CRASH IN U.S. HISTORY

Economic Collapse
August 24, 2015


Sunrise Globe Earth Planet Space - Public DomainWe witnessed something truly historic happen on Friday.  The Dow Jones Industrial Average plummeted 530 points, and that followed a 358 point crashon Thursday.  When you add those two days together, the total two day stock market crash that we just witnessed comes to a grand total of 888 points, which is larger than any one day stock market crash in U.S. history.  It is also interesting to note that this 888 point crash comes in the 8th month of our calendar.  Perhaps that is just a coincidence, and perhaps it is not.  It just struck me as being noteworthy.  This is the first time that the Dow has dropped by more than 300 points on two consecutive days since November 2008, and we all remember what was happening back then.  Overall, this was the worst week for the Dow in four years, and there have only been five other months throughout historywhen the Dow has fallen by more than a thousand points (the most recent being October 2008).  Of course we still have six more trading days left in August, so there is plenty of time remaining for even more carnage.
By itself, the 530 point plunge on Friday was the ninth worst stock market crash in all of U.S. history.  The following list of the top eight comes from Wikipedia…
#1 2008-09-29 −777.68
#2 2008-10-15 −733.08
#3 2001-09-17 −684.81
#4 2008-12-01 −679.95
#5 2008-10-09 −678.91
#6 2011-08-08 −634.76
#7 2000-04-14 −617.77
#8 1997-10-27 −554.26
Another very interesting thing to note is that the largest stock market crash in U.S. history took place on the very last day of the Shemitah year of 2008, and now we are less than a month away from the end of this current Shemitah year.
It is funny how these strange “coincidences” keep happening.
The financial carnage that we witnessed on Friday was truly global in scope.  On a percentage basis, Chinese stocks crashed even more than U.S. stocks did.  Japanese stocks also crashed, so did stock markets all over Europe, and emerging market currencies all over the planet got absolutely destroyed.
The following is how Zero Hedge summarized what went down…
  • China’s worst week since July – closes at 5 month lows
  • Global Stocks’ worst week since May 2012
  • US Stocks’ worst week in 4 years
  • VIX’s biggest weekly rise ever
  • Crude’s longest losing streak in 29 years
  • Gold’s best week since January
  • 5Y TSY Yield’s biggest absolute drop in 2 years
Even though I specifically warned that this would happen, and have been explaining why it would happen on my website in excruciating detail for months, the truth is that I didn’t expect stocks to start crashing this quickly or this ferociously.
Normally, August is a fairly slow month in the financial world.  As I have discussed previously, most of the really noteworthy stock market crashes throughout history have taken place during the months of September and October.  So I thought that things wouldn’t start getting really crazy for another few weeks at least.
Financial markets tend to fall much faster than they go up, and I believe that we are moving into a time of extraordinary volatility.  There will be huge down days, and there will also be huge up days.  In fact, the three largest single day rallies in Dow history happened right in the middle of the financial crisis of 2008.  So don’t let what happens on any one particular day fool you.

GREEK BAILOUT DETAILS PORED OVER ACROSS EUROPE

Associated Press
August 13, 2015

Details of Greece’s latest bailout package were being pored over across Europe on Wednesday as Prime Minister Alexis Tsipras insisted the agreement with creditors would put “a definitive end” to the country’s economic uncertainty.
Tsipras has called an emergency session of parliament to discuss and vote on the bill, which includes painful tax hikes and spending cuts, in time for a possible meeting of the eurozone’s 19 finance ministers Friday.
The agreement must be finalized so funds on offer can be released in time for Greece to avoid defaulting on a big debt repayment to the European Central Bank on Aug. 20.

MILITARY SITE’S FORECAST FOR 2025: ECONOMIC COLLAPSE WILL LEAD TO MASSIVE 78% DEPOPULATION IN AMERICA

SHTF Plan
May 7, 2015

With economic malaise on the horizon and any number of triggers ready to set things into motion, military site Deagel.com recently posted their global forecast for 2025. The site, rumored to be a front for various alphabet intelligence agencies, says that America will soon see a large reverse migration as those who came here seeking riches and safety will emigrate out of the country following a serious, multi-year crisis.
According to the report the economy of the United States will dwindle from a GDP of $17.4 trillion today to just over $800 billion in the next 10 years – a decline of about 95% with respect to the goods and services produced within our own borders. Such a decline would be staggering, but it’s not the most ominous aspect of the report.
According to Deagel, the real concern is the adverse effects on our population, which is currently just under 319 million. If the forecast, which does not include the possibility of war or widespread pandemic in its analysis, is accurate then America may experience an event so massive that some 78% of our population would be wiped out, leaving just 68 million people living on American soil by 2025. 
The key element to understand the process that the USA will enter in the upcoming decade is migration. In the past, specially in the 20th century, the key factor that allowed the USA to rise to its colossus status was immigration with the benefits of a demographic expansion supporting the credit expansion and the brain drain from the rest of the world benefiting the States.
 The collapse of the Western financial system will wipe out the standard of living of its population while ending ponzi schemes such as the stock exchange and the pension funds. The population will be hit so badly by a full array of bubbles and ponzi schemes that the migration engine will start to work in reverse accelerating itself due to ripple effects thus leading to the demise of the States. This unseen situation for the States will develop itself in a cascade pattern with unprecedented and devastating effects for the economy.
Jobs offshoring will surely end with many American Corporations relocating overseas thus becoming foreign Corporations! We see a significant part of the American population migrating to Latin America and Asia while migration to Europe – suffering a similar illness – won’t be relevant. Nevertheless the death toll will be horrible. Take into account that the Soviet Union’s population was poorer than the Americans nowadays or even then. The ex-Soviets suffered during the following struggle in the 1990s with a significant death toll and the loss of national pride. Might we say “Twice the pride, double the fall”? Nope. The American standard of living is one of the highest, far more than double of the Soviets while having added a services economy that will be gone along with the financial system. When pensioners see their retirement disappear in front of their eyes and there are no servicing jobs you can imagine what is going to happen next. At least younger people can migrate. Never in human history were so many elders among the population. In past centuries people were lucky to get to their 30s or 40s.
The American downfall is set to be far worse than the Soviet Union’s one. A confluence of crisis with a devastating result.
With the predicted mass migration and drop in economic productivity will come other changes, according to Deagel. Military expenditures will drop significantly from $756 billion annually to $7.2 billion, and population density will drop from the current 33 inhabitants living per square kilometer to just 7 people taking up the same space ten years from now.
The report is certainly controversial, especially given that the source is unclear. The site claims to be a ‘Guide to Military Equipment and Civil Aviation’ that is maintained by private individuals who have no relationship whatsoever with the government. But some sources have reported that Deagel has done business in one form or fashion with various intelligence groups.
Thus, we publish this report with some hesitation and a healthy bit of skepticism, yet find it compelling enough given the current global environment that it may be of interest to readers.
The idea that a major depopulation event in the United States can happen as a result of a widespread crisis is a topic we’ve covered previously. The Center For Security Policy published a report in 2010 outlining the dangers posed by a targeted electro-magnetic pulse (EMP) attack against the United States. According to that report, which has been shared with Congress, up to 90% of Americans could die within a year:
And experts forecast if such an attack were a success, it effectively could throw the U.S. back into an age of agriculture.
“Within a year of that attack, nine out of 10 Americans would be dead, because we can’t support a population of the present size in urban centers and the like without electricity,” said Frank Gaffney, president of the Center for Security Policy.
An EMP threat is certainly a completely different set of circumstances than an economic collapse, at least initially. But as survival author James Rawles notes in his fictional, yet quite believable, account of economic collapse in his widely popular book Patriots: A Novel Of Survival In The Coming Collapse, the notion that the economic system could break down to such an extent as to cause a major die-off in America is a distinct, albeit improbable, possibility.
In fact, the U.S. government has been training for just such a scenario in recent years, a concern highlighted by popular radio talk show host Mark Levin:
I’ll tell you what I think they’re simulating.
The collapse of our financial system, the collapse of our society and the potential for widespread violence, looting, killing in the streets, because that’s what happens when an economy collapses.
I’m not talking about a recession. I’m talking about a collapse, when people are desperate, when they can’t get food or clothing, when they have no way of going from place to place, when they can’t protect themselves.
There aren’t enough police officers on the face of the earth to adequately handle a situation like that.
Though Deagel.com makes some seemingly outrageous claims in their 2025 Forecast, within this context the possibility of a major depopulation event begins to look more and more probable.

The death of the American pension: How older Americans are entering their golden years with a lack of retirement savings.

MyBudget360
May 6, 2015

Listen carefully to the sales pitch from Wall Street.  In the late 1970s and the early 1980s there was a push to get Americans away from pension plans and into 401k style retirement plans.  The notion was that Americans would save enough on their own and would have the financial wherewithal to play in the Wall Street finance game.  Well here we are a generation later and for most Americans, the self-directed retirement experiment has been an abject failure.  We have now learned about a litany of mutual funds that have charged high expense ratios that basically ate into a good chunk of savings.  The ETF and index fund world is new for many since it isn’t heavily marketed.  And these are the options for the savvy people that actually dive in.  Pension plans used to be commonplace.  Now, they are rare and are headed to extinction.  For most elderly Americans, the number one source of income is coming from Social Security.  What happened to the pension plans of America?
The destruction of pensions
Pensions were popular during a time of long-term company loyalty.  People worked a large portion of their lives with one organization and after many years, based on your salary and years worked, you would receive a monthly payment until the end of your days.  The cost of pensions of course started becoming unsupportable as lifespan grew but also, investment returns were not keeping up.
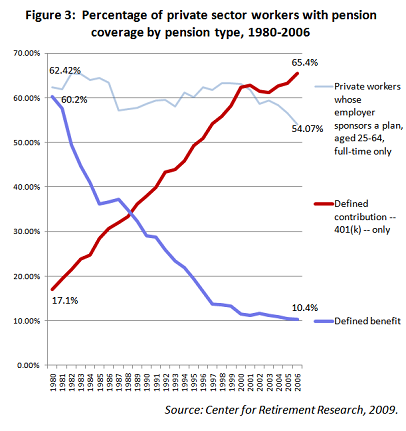
The 401k became widespread in the early 1980s as a cheaper alternative to pension plans:
pensions
60 percent of Americans working in private sector companies back in 1980 were given access to defined benefit plans.  The chart above is unmistakable and shows a clear pathway as to what won out in the private sector.  Pensions were let go in favor of 401ks.  Defined contribution plans give you the benefit of saving pre-tax.  This is a good deal but with the large number ofAmericans working in low wage jobs, there is very little to save once you factor in all the costs associated with life.  As with medical care and college a big portion of the cost is now being shifted to workers.
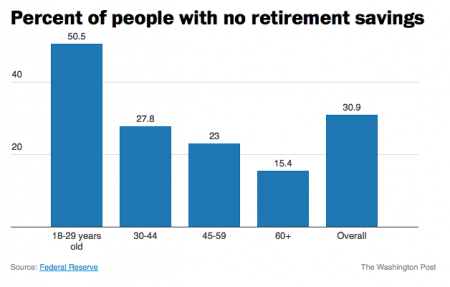
The number of Americans with no retirement savings is startling:
retirement-savings
30 percent of Americans have no retirement savings to speak of.  Defined benefit plans worked in a similar fashion to Social Security.  You paid in and were given a guaranteed payout when you retired.  These were great deals for workers because in most cases, more was paid out than went in and since the amount paid was defined, you were guaranteed a fixed amount.  You can see how the math on this would get problematic.  Of course with a 401k, you are at the whim of the stock market.  Just imagine you retired and then 2007 through 2009 hit.  Hopefully people are rebalancing appropriately as they get closer to their retirement age.  The fact that the numbers look so grim, we know the reality is very different.
The reason pensions have also gone away is the optimistic assumption behind the numbers.  Gains are harder to find and many pension plans had unrealistic expectations of 7 to 8 percent returns every year ad infinitum.  That gets you into trouble and there are countless underfunded pensions across the country.
It is interesting to hear the narrative around this.  There seemed to be an angry backlash against pensions even though these likely were aiding the middle class.  Wall Street financial giants don’t need pensions when they can gamble and speculate with all the protection of the Fed and favorable bailout policies. Does the public have this kind of access?  Unfortunately they do not.
Many people have a tough time saving.  Half the country lives paycheck to paycheck.  A better option would be to offer a hybrid plan, one that forces employee savings and a 401k like defined contribution plan:
“(Workforce) Most people are ill-suited to manage their money, so what we might see going forward is one of these hybrid plans, in a defined contribution environment, where the employee still holds the risk but has a more stable retirement fund,” van Iwaarden says. “And I would still not be surprised to see some resurgence of defined benefit plans for tax-motivated employers.”
A hybrid plan works much better because it goes around basic human nature to avoid saving money but also allows those who want to save more to do so.  These are rare.  Most are afforded only the 401k option.  Pensions are heading to extinction and a generation later, we realize most will live a life of work into retirement.

Steve Wynn : "The Idea That America is in a Recovery is Pure Fiction"

SIC SEMPER TYRANNIS!!! News
Mark Matheny
May 6, 2015
Steve Wynn: Getty Photo

 Stephen "Steve" Wynn is an American business magnate. He played a pivotal role in the 1990s resurgence and expansion of the Las Vegas Strip. His companies refurbished or built what are now widely recognized resorts in Las Vegas, including the Golden Nugget, The Mirage, Treasure Island, Bellagio, Wynn, and Encore.

While being interviewed May 4th on Ralston Live, Steve had this to say about the supposed recovery that the Obama administration had been peddling....


"The idea that America is in the grips of a great recovery is pure fiction. It's a lie. It's not true. It's a jobless recovery. Because recoveries are marked by the amount of real employment. And if you count the people that have left the workforce, really unemployment is 15 to 20 percent.If you take real inflation, and you gotta count energy and food, and all that stuff, inflation is much higher than they say it is.  

My employees' take home pay, in spite of the increases we give them, their paychecks are 90 cent paychecks, on the dollar. It's very difficult to explain to a normal working citizen the implications, that is not a soundbite subject, of what 18 trillion dollar in debt means, and what it means when the Federal Reserve buys the U.S. Treasury Bonds to finance our loss in downtown Washington. People think that is some abstract conversation for pundits... in fact, it impacts every one of my employees critically everyday. They notice when they sit down at the kitchen table, that after they pay the necessities, there just isn't any money left.."
I have been saying that it was a phony recovery since the Obama administration called it the "summer of recovery". I called it the "summer of discontent", but who am I? you may say.

Well, Steve Wynn is no Schmuck, and he calls Obama's recovery a lie....

You can hear Steve's comments at the 9:20 mark of the interview here


(here's a report I did back in 2012 on real unemployment numbers and the phony recovery)