Showing posts with label National debt. Show all posts

US Gov/Central Bankers Hyping Propaganda To Invade Syria

Investment Watch
March 21, 2015

Greek Government Is Now Raiding Utilities To Make Their Payments. Greek Deposit Outflows Peak. Anti-austerity Protests Increasing Throughout Europe.


Greek government is now raiding utilities to make their payments. Greek deposit outflows peak. Anti-austerity protests increasing throughout Europe. European government implements laws to shutdown websites. Ukrainian government is not sticking to the Minsk II agreement, preparing for war. UK to begin training of Ukrainian forces. John Kerry says that Assad must step down. US hyping propaganda to invade Syria. Embassies in Djibouti and Saudi Arabia are still closed.

The Legacy of Debt: Interest Costs Poised to Surpass Defense and Nondefense Discretionary Spending

Wall Street Journal
February 3, 2015

The U.S. has come a long way since the days of trillion-dollar deficits, just a few years ago. The White House projects 2016 will have the smallest budget deficit in eight years. Yet the budgetary impact of the debt that’s been accumulated–$18 trillion in total, $13 trillion of that owed to the public–will reassert itself.
Currently, the government’s interest costs are around $200 billion a year, a sum that’s low due to the era of low interest rates. Forecasters at the White House andCongressional Budget Office believe interest rates will gradually rise, and when that happens, the interest costs of the U.S. government are set to soar, from just over $200 billion to nearly $800 billion a year by decade’s end.
By 2021, the government will be spending more on interest than on all national defense. according to White House forecasts. And one year later, interest costs will exceed nondefense discretionary spending–essentially every other domestic and international government program funded annually through congressional appropriations. (The largest part of the budget is, and will remain, the mandatory spending programs of Social Security, Medicare and Medicaid. Mandatory spending is over $2 trillion and is set to double to $4 trillion by 2025.)
The total dollars spent on defense and nondefense discretionary spending will continue to rise, albeit slowly, in the coming decade. But as a share of the economy, both categories of spending are poised to shrink for the next decade, squeezed down as interest rates rise. Mandatory spending will rise from 12.4% of GDP to about 14.5% of GDP over this period.
By 2025, the White House projects interest costs will be 2.8% of GDP. The CBO is somewhat less optimistic and expects it will be 3%. Most economists and budget experts would agree that interest payments at 3% of GDP are manageable for an economy. The true cost may be the squeeze to other places the government could be spending a decade from now.

11,004,507: Disability Beneficiaries Top 11 Million for First Time

CNS News 
June 20, 2014

(CNSNews.com) - The total number of disability beneficiaries in the United States topped 11 million for the first time last month, increasing from 10,996,447 in April to a record 11,004,507 in May, according to new datareleased by the Social Security Administration.
Americans on Disability Tops 11,000,000 for First Time
The number of Americans receiving disability benefits continues to exceed the population of Greece, Tunisia and Portugal and is drawing closer to Cuba, whose population of 11,047,251 (as reported by the CIA) is just 42,477 more than the 11,004,507 Americans receiving disability benefits.
Disability Beneficiaries Closing in on Population of Cuba
The 11,004,507 total disability beneficiaries in May included a record 8,947,220 disabled workers. It also included 153,554 spouses of disabled workers and 1,903,733 children of disabled workers.
The previous record for disabled workers alone (not counting spouses and children receiving benefits) was the 8,942,584 recorded in December 2013.

THE UNITED STATES OF DEBT: TOTAL DEBT IN AMERICA HITS A NEW RECORD HIGH OF NEARLY 60 TRILLION DOLLARS

Economic Collapse
June 16, 2014

What would you say if I told you that Americans are nearly 60 TRILLION dollars in debt?

What would you say if I told you that Americans are nearly 60 TRILLION dollars in debt?  Well, it is true.  When you total up all forms of debt including government debt, business debt, mortgage debt and consumer debt, we are 59.4 trillion dollars in debt.  That is an amount of money so large that it is difficult to describe it with words.  For example, if you were alive when Jesus Christ was born and you had spent 80 million dollars every single day since then, you still would not have spent 59.4 trillion dollars by now.  And most of this debt has been accumulated in recent decades.  If you go back 40 years ago, total debt in America was sitting at about 2.2 trillion dollars.  Somehow over the past four decades we have allowed the total amount of debt in the United States to get approximately 27 times larger.  This is utter insanity, and anyone that thinks this is sustainable is completely deluded.  We are living in the greatest debt bubble of all time, and there is no way that this is going to end well.  Just check out the chart…
Total Debt
When the last recession hit, total debt in America actually started going down for a short period of time.
But then the Federal Reserve and our politicians in Washington worked feverishly to reinflate the bubble and they assured everyone that everything was going to be just fine.  So Americans once again resorted to their free spending ways, and now total debt in the United States is rising at almost the same trajectory as before and has hit a new all-time record high.
We see a similar thing when we look at a chart for consumer debt in America…
Total Consumer Credit
For a while after the recession it was trendy to cut up your credit cards and get out of debt.
But that fad wore off rather quickly, didn’t it?
It is almost as if 2008 never happened.  We are making the same mistakes with debt that we did before.
As I noted recently, total consumer credit in the U.S. has risen by 22 percent over the past three years alone, and at this point 56 percent of all Americans have a subprime credit rating.
And have you noticed that a lot of people are not afraid to extend themselves in order to buy shiny new vehicles these days?
During the first quarter 0f this year, the size of the average vehicle loan soared to a new all-time record high of $27,612.
Five years ago, that number was just $24,174.
And as I noted in one recent article, the size of the average monthly car payment in this country is now up to $474.
That is practically a mortgage payment.
Speaking of mortgage payments, even though home sales have been falling and the rate of homeownership in the United States is the lowest that it has been in 19 years, a very large percentage of those who own homes are still overextended.
In fact, one recent survey discovered that a whopping 52 percent of Americans cannot even afford the house that they are living in right now.
At the same time, an increasing number of Americans are acting as if the last financial crisis never happened and are treating their homes like piggy banks.   Home equity loans are soaring again, and when the next great crisis strikes a lot of those people are going to end up getting into a lot of financial trouble.
There has been much written about what is wrong with the housing industry, but the truth is that home prices are still way too high and young adults cannot afford to purchase homes because they are already loaded down by huge amounts of debt even before they get to the point where they are ready to buy.
In fact, a newly released survey found that 47 percent of millennials are spending at least half of their paychecks on paying off debt…
Four in 10 millennials say they are “overwhelmed” by their debt — nearly double the number of baby boomers who feel that way, according to a Wells Fargo survey of more than 1,600 millennials between 22 and 33 years old, and 1,500 baby boomers between 49 and 59 years old.
To try to get out from underneath it, 47% said they spend at least half of their monthly paychecks on paying off their debts.
When I read that I was absolutely astounded.
Of course the biggest debt that many young adults are facing is student loan debt.  According to the Federal Reserve, there is now more than 1.2 trillion dollars of student loan debt in this country, and about 124 billion dollars of that total is more than 90 days delinquent.
What we have done to our young people is shameful.  We have encouraged them to sign up for a lifetime of debt slavery before they even understand what life is all about.  The following is an excerpt from my previous article entitled “Is College A Waste Of Time And Money?“…
In America today, approximately two-thirds of all college students graduate with student loan debt, and the average debt level has been steadily rising.  In fact, one study found that “70 percent of the class of 2013 is graduating with college-related debt – averaging $35,200 – including federal, state and private loans, as well as debt owed to family and accumulated through credit cards.”
That would be bad enough if most of these students were getting decent jobs that enabled them to service that debt.
But unfortunately, that is often not the case.  It has been estimated that about half of all recent college graduates are working jobs that do not even require a college degree.
Considering what you just read, is it a surprise that half of all college graduates in America are still financially dependent on their parents when they are two years out of college?
According to the U.S. Census Bureau, only 36 percent of all Americans under the age of 35 own a home at this point.  That is the lowest level that has ever been recorded.
And we are passing on to our young people the largest single debt in all of human history.  Weighing in at 17.5 trillion dollars, the U.S. national debt is a colossal behemoth.  And almost all of that debt has been accumulated over the past 40 years.  In fact, 40 years ago the U.S. national debt was less than half a trillion dollars.
But this is just the beginning.  As the Baby Boomer “demographic tsunami” washes through our economy, we are going to be facing a wave of red ink unlike anything we have ever contemplated before.
Meanwhile, the rest of the planet is drowning in debt as well.
As I wrote about the other day, the total amount of debt in the world has risen to a new all-time record high of $223,300,000,000,000.
Our “leaders” keep acting as if these debt levels can keep growing much faster than the overall level of economic growth indefinitely.
But anyone with even a shred of common sense knows that you can’t spend more money that you bring in forever.
At some point, a day of reckoning arrives.
2008 should have been a major wake up call that resulted in massive changes.  But instead, our leaders just patched up the old system and reinflated the old bubbles so that they are now even larger than they were before.
They assure us that they know exactly what they are doing and that everything will be just fine.
Unfortunately, they are dead wrong.

+106%: Obama Has More Than Doubled Marketable U.S. Debt

CNS News
February 19, 2014

(CNSNews.com) - The marketable debt of the U.S. government has more than doubled--climbing by 106 percent--while President Barack Obama has been in office, increasing from $5,749,916,000,000 at the end of January 2009 to $11,825,322,000,000 at the end of January 2014, according to the U.S. Treasury's latest Monthly Statement of the Public Debt.
During the eight-year presidency of George W. Bush, the marketable debt of the U.S. government almost doubled--climbing 93 percent--from $2,977,328,000,000 at the end of January 2001 to $5,749,916,000,000 at the end of January 2009.
During the time that Bush and Obama have been in office, the marketable debt of the U.S. government has nearly quadrupled, increasing by $8,847,994,000,000.
Chart of Marketable Debt
However, despite the massive increase in the government's marketable debt during Bush's eight years, Obama managed to accumulate more additional marketable debt in his first five years in office than all the presidents who preceded combined.

Obamacare Is Going To Be The Biggest Expansion Of The Welfare State In U.S. History

Michael Snyder
November 22, 2013
Can the U.S. government afford to pay for the health care of 38 million more people?  As you will see below, Obamacare is going to be the biggest expansion of the welfare state in U.S. history.  It is being projected that a decade from now 17 million Americans will be receiving Obamacare subsidies and an additional 21 million Americans will have been added to the Medicaid rolls.  At a time when we are already running trillion dollar deficits, is this really something that the government should be taking on? 
Image: Barack Obama (Wikimedia Commons.
In addition, it is being projected that bringing millions upon millions of new people into the Medicaid program will also cause enrollment in many other federal welfare programs such as food stamps to surge.  Right now, the percentage of Americans that are financially dependent on the U.S. government is already at an all-time high, and Obamacare is going to cause the level of government dependence to go much, much higher.  But how much weight can the “safety net” actually carry before it breaks entirely?
Since October 1st, the number of Americans enrolling in Medicaid has surprised many government officials.  For example, as USA Today recently reported, the number of Americans signing up for Medicaid is far surpassing the number of Americans signing up for private health insurance policies in many states…
States are reporting far higher enrollment in Medicaid than in private insurance since the Affordable Care Act exchanges opened Oct. 1. In Maryland, for example, the number of newly eligible Medicaid enrollees is more than 25 times the number of people signed up for private coverage.
And there are some Americans that are going to the health care exchanges intending to buy private coverage that are finding out that they are only being given the option to enroll in Medicaid instead.  The following example comes from the Wall Street Journal
The situation sounded absurd, so I asked her to walk me through her application on Washington Healthplanfinder to make sure she wasn’t missing anything. Sitting in New York with my computer, I logged onto the site under her name and entered the information my mother provided over the phone. I fully expected her to realize that she had forgotten some crucial piece of information, like a decimal point in her annual income. We checked and double-checked the information, but the only option still appeared to be Medicaid. She suggested clicking on “Apply for Coverage,” thinking that other options might appear.
Instead, almost mockingly, her “Eligibility Results” came back: “Congratulations, we received and reviewed your application and determined [you] will receive the health care coverage listed below: Washington Apple Health. You will receive a letter telling you which managed care plan you are enrolled with.” Washington Apple Health is the mawkish rebranding of Medicaid in Washington state.
The page lacked a cancel button or any way to opt out of Medicaid. It was done; she was enrolled, and there was nothing to do but click “Next” and then to sign out.
As you read this, there are more than 62 million Americans enrolled in Medicaid right now.
According to Obamacarefacts.com (a pro-Obamacare website), Obamacare could add 21 million more Americans to the Medicaid rolls over the next decade.
And according to a report that came out earlier this month, 17 million Americans will qualify for Obamacare subsidies.
So when you add those numbers together (21 million plus 17 million), you come up with a total of 38 million more people that the government will soon be providing health care for.
And that does not even take into account more than 20 million elderly Americans that will be added to the Medicare program by 2025 as our population rapidly ages.
The government is going to have to find a whole lot of money from somewhere to pay for all of this.
And as I mentioned above, it is being projected that this surge in Medicaid enrollment will also be accompanied by a surge in enrollment in other welfare programs such as food stamps.   Just check out the following excerpt from a recent Politico article
Noting that the Affordable Care Act “could potentially have a profound impact on SNAP participation,” the Agriculture Department announced its plans to study the possible development last week in a document submitted to the Office of Management and Budget for review.
The department says it wants to look into state coordination of SNAP and Medicaid enrollment and renewal, the process for directing Medicaid applicants to SNAP and the number of SNAP applications.
Lawmakers who have advocated for SNAP stressed that the increase in food stamp recipients would result from people who should already have been in the program.
“If people are eligible, they ought to be enrolled in it, so that’s a good thing,” said Rep. Jim McGovern (D-Mass.), a farm bill conferee who has stated that he would not vote for a bill that includes significant cuts to SNAP, in a phone interview with POLITICO.
So we could ultimately end up with millions upon millions more Americans enrolled in food stamps and other major federal welfare programs.
Not that helping the poor is a bad thing.  It certainly isn’t.
But at some point if too many people jump on the “safety net” it is going to break.
According to the most recent numbers from the U.S. Census Bureau, 49.2 percent of all Americans are currently receiving benefits from at least one government program each month.
That is nearly half the country.
Most of the people that are receiving these benefits actually need them and would be glad to get off of these programs if they could.
However, without a doubt there are some people out there that are abusing the system.
For example, one welfare recipient recently called into a radio show in Texas and was completely unapologetic about the fact that she planned to stay on welfare for the rest of her life…
While workers out there are preaching morality at people like me living on welfare, can you really blame us?
I get to sit home… I get to go visit my friends all day… I even get to smoke weed…
Me and people that I know that are illegal immigrants that don’t contribute to society, we still gonna get paid.
Our check’s gonna come in the mail every month… and it’s gonna be on time… and we get subsidized housing… we even get presents delivered for our kids on Christmas… Why should I work?
Ya’ll get the benefit of saying “oh, look at me, I’m a better person,” but when ya’ll sit at home behind ya’lls I’m a better person… we the ones gettin’ paid!
So can you really blame us?
You can find a YouTube video of the entire conversation right here.
Once again, the vast majority of Americans on welfare are not like this.
Most Americans would prefer to have a good job or to own a thriving business and be providing for themselves.  But as our economy continues to decline, the number of Americans that are able to independently take care of themselves will continue to go down.
Right now, the percentage of Americans that are dependent on the government is already at an all-time high, and Obamacare is going to add tens of millions more Americans to the welfare rolls.
So what does this mean for the future of our country?  Please feel free to share what you think by posting a comment below…

WILL U.S. PUBLIC DEBT REACH $22 TRILLION BY FEB. 2014?

etf Guide
October 22, 2013

objectRon DeLegge, Editor
Just imagine an undisciplined out-of-control spender whose credit limit has just been extended. In other words, they can continue overspending without any accountability. That “they” is the U.S. government.
It’s been almost a week since Congress reached a temporary deal to suspend the U.S. government’s debt ceiling and the Treasury department has already wasted no time by adding another $375 billion in new debt.
Suspension of a cap on U.S. debt, which was previously fixed at $16.69 trillion, means the Treasury department, headed by Jack Lew, can effectively spend whatever amount of money it needs or wants.
How much debt can the U.S. government rack up by the next debt ceiling deadline on Feb. 7, 2014? At the current spending pace of $375 billion per week, U.S. public debt would reach $22.70 trillion.
Numerous times, we’ve written extensively about how the U.S. Treasury had been using accounting shenanigans to avoid going over the previous legal debt limit. We also made the point that any corporation or corporate executive that attempted to use the U.S. Treasury’s same accounting tactics would be charged with fraud. Others too have caught on to the U.S. Treasury’s financial games.

"When you are the largest economy in the world, when you are the safe haven in all circumstances, as has been the case, you can't go into that creative accounting business," said International Monetary Fund Managing Director Christine Lagarde in an interview with NBC News' Meet the Press.
What does the bond market have to say about this?


After reaching a yearly high of 2.97%, the yield on 10-year U.S. Treasuries (NYSEARCA:IEF) has since fallen by 12.5%. Put another way, the bond market is saying that it doesn’t care about the fiscal realities of the U.S. government’s unmanageable debt load. Eventually, when it does start caring, that reality will be first reflected in key price levels highlighted in our latest Technical Forecast
In the meantime, Treasury bulls are celebrating. 
ETFs that benefit from lower yields and higher Treasury bond prices like the ProShares Ultra 20+ Yr. Treasury ETF (NYSEARCA:UBT) and the Direxion Daily 20+ Yr. Treasury Bull 3x Shares (NYSEARCA:TMF) have gained between 8% to 12% since early September. Treasury bonds with long-term maturities (NYSEARCA:TLT) like those tracked by UBT and TMF are most sensitive to changes in interest rates compared to Treasuries (NYSEARCA:SHY) with maturities of less than 10-years.
The table above is from the U.S. Treasury’s daily statement.

The ETF Profit Strategy Newsletter uses a combination of market sentiment, fundamental/technical analysis, market history, and common sense to be on the right side of the market. Since the beginning of the year, 74% of our time stamped ETF picks have turned a profit and our biggest win was a +525% gainer. (through 9/30/13)

Follow us on Twitter @ ETFguide

U.S. Is Broke, Can't Afford to Raise the Debt Ceiling

SIC SEMPER TYRANNIS!!!
Mark Matheny
September 26, 2013

Obama is claiming that raising the Debt Ceiling in the U.S. doesn't raise the debt. We know however that over the last 100 times that Congress raised the debt ceiling, our debt has increased with it. Peter Schiff is saying that the U.S. is so broke we are not in a position to raise the debt ceiling anymore.


Fed downgrades its outlook for US economy

Yahoo Finance
Associated Press
September 19, 2013
Ben Bernanke

WASHINGTON (AP) -- The Federal Reserve on Wednesday downgraded its outlook for the U.S. economy for 2013 and 2014. In doing so, it underscored concerns that led it to maintain the pace of its stimulus.
The Fed predicted Wednesday that the economy will grow just 2 percent to 2.3 percent this year, down from its previous forecast in June of 2.3 percent to 2.6 percent growth.
Next year's economic growth will be a barely healthy 3 percent, the Fed predicts.
Fed officials decided to continue their $85-billion-a-month bond purchase program, surprising most economists, who had expected a slight reduction. The bond purchases have been designed to keep long-term loan rates low to encourage spending.
The Fed's policymakers expect the unemployment rate to fall to 7.1 percent to 7.3 percent by the end of 2013, slightly below its June forecast of 7.2 percent to 7.3 percent. It predicts that unemployment will fall as low as 6.4 percent next year, down from 6.5 percent in its June forecast.
The unemployment rate is now 7.3 percent.
The projections showed that 12 of the 17 officials on the Fed's policymaking committee think the Fed shouldn't begin raising rates until 2015. And two think the Fed shouldn't do so until 2016, one more than in June. Three chose 2014, the same as in June.
The Fed doesn't say which policymakers made which forecast.

Sequestering the working and middle class – The implications of runaway debt. GDP at record levels yet nonfarm employment is 4 million below previous peak. Trillion dollar coins. Greece unemployment reaches a new record.

MyBudget360
January 13, 2013


Gear up those printing presses.  You might be thinking that some of the policy talk coming out today is from The Onion but no, the idea of a $1 trillion coin is being discussed.  The Federal Reserve is already very willing to become a shadow bad bank and take on all the questionable assets from the latest bubble from member banks.  As the middle class is crushed, our nation is becoming more polarized.  You have a massively large group of people that are now classified as poor in the world’s wealthiest nation.  We have over 47 million Americans on food stamps.  Theaverage per capita pay is $26,000 much to the surprise of many people conditioned on only getting their data from the mainstream press.  Those that deny inflation are not looking hard enough.  The purchasing power for working and middle class Americans is being slowly destroyed.  Europe is still facing major headwinds with Greece reaching a troubling new record with their unemployment rate.  All this rhetoric means the Fed and ECB will continue on their path of quantitative easing and digital money printing.
Sequestering the working and middle class
One of the major stories that was not reported during this crisis is that many companies used the economic crisis as a reason to lay off employees or slash wages.  Yet by looking at GDP, you will realize that we are at a current peak yet nonfarm employment is down by 4 million from the previous peak:
GDP and nonfarm employment
In other words we are producing just as much with far fewer people.  Where are these people now?  Many of them are now on food stamps.  Over 47 million Americans are receiving food assistance.  Their voice is largely unheard and politicians have little incentive to recite their concerns.  We are now stumbling from one crisis to another like a drunkard.  Only a few hours after the fiscal crisis was diverted for the short-term we were then talking about the debt ceiling.  This even inspired the idea of minting a trillion dollar platinum coin to pay off some of our national debt.
It would be comical if it were not so absurd.  The GDP equation is rather simple:
GDP = private consumption + gross investment + government spending + (exports − imports)
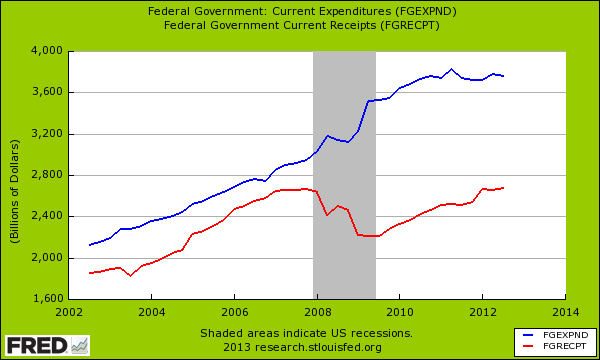
We’ve been going hog wild on the government spending portion recently.  Take a look at the current government spending and revenues:
fed spending
After the recession government spending ramped up dramatically to make up for the losses in revenue.  But we are still spending at record levels while not taking in enough.  We are running gargantuan trillion dollar deficits for as far as the eye can see.  Maybe minting a few trillion dollar coins isn’t such a bad idea.  We wouldn’t be the first nation to lead this charge.  Zimbabwe already went down this road with a trillion dollar note:
Zimbabwe_$100_trillion_2009_Obverse(1)
Nothing bad ever came from that right?  The problem with the road we are leading in is that the US middle class is being crushed.  Even projections for this are highlighted in many reports:
share of middle class
For the very wealthy, they don’t mind pursuing this global low wage system where they can squeeze dollars all around the planet.  Do you want to work for $1,000 or $2,000 per year?  This is the future for many.
There really are no easy decisions.  Take a look at a high wage system with cronyism in their government, Greece.  They recently just reached a new peak unemployment rate of 26.8 percent:
unemployment greece
Youth unemployment (15 to 24) is now up to 56.6 percent.  So much for high unemployment suddenly creating a healthier marketplace and a fertile environment for the middle class.  This sequestering of the middle class has been ongoing for a few decades now and has happened under both political parties.  People need to wake up and pay attention to what is really going on.  These massive increases in debt do come at a price.  Maybe a trillion dollar coin is our sale price.

Majority of voters see America on wrong track

NBC News
November 6, 2012


As voters left polling places Tuesday, a majority told exit poll interviewers they felt the country was “seriously off on the wrong track.” But the mood of the electorate was markedly more optimistic than it was four years ago, when a record three out of four voters said the country was on the wrong track.
In preliminary results from early voters in the national NBC News exit poll, 52 percent said America was on the wrong track while 46 percent said the nation was"generally going in the right direction."
Preliminary results from exit polls also showed that most voters, 53 percent, thought the federal government is doing too much, a sharp contrast with four years ago, when the country was in the midst of a financial and economic crisis. At that time only 43 percent of voters said the government was doing too much and a majority, 51 percent, thought the government ought to do more to try to solve the nation’s problems.

False prosperity through debt – 4 out of 10 Americans have less than $500. The dangers of building a consumption based nation.

MyBudget360
October 22, 2012


If most Americans had to choose between saving and spending, they would decide to join the spending team.  Americans are so drawn to spending that they will even purchase items they cannot afford.  Another recent survey found that 40 percent of Americans have less than $500 saved.  This aligns with a survey we found last year stating one out of every three Americans has nearly no savings.  How is it possible that in the most prosperous nation in the world that we have an addiction to spending but also financing this spending through incredibly high levels of debt?  We are reaching a level of peak debt for our nation and it is understandable that we cannot continue on this path.  Of course platitudes and lip service abound but a national debt of over $16 trillion reflects a nation willing to go into massive debt to keep the dance going for a few more hours.
Financing a generation on debt
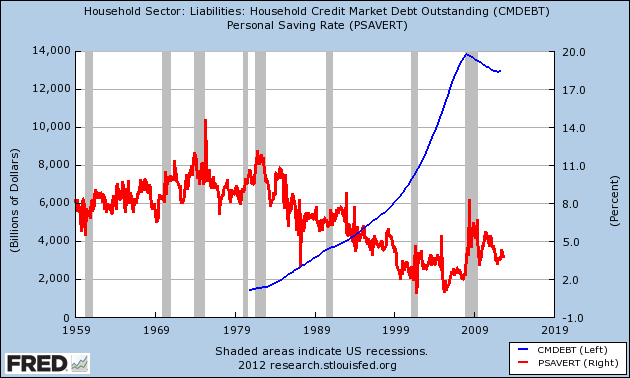
One of the more telling charts is looking at household debt versus the actual personal savings rate:
savings and household debt
From 1950 to the early 1980s, Americans were saving roughly 10 percent of their income.  Keep in mind this also occurred during a period where companies offered generous retirement plans and pensions.  However, starting in the 1980s Americans started spending more of what they earned and financing much of their consumption.  You can see this by looking at the blue line above.  The party must have seemed like it would never end.  Household debt went from the $1 trillion range in the 1970s all the way up to over $14 trillion at our recent peak.
Financing this misadventure must have appeared like a good idea to many.  Buying houses people couldn’t afford and financing cars that many clearly could not sustain.  As a nation we are hyper-consumers.  This generation long obsession is reflected in how our government spends.  We want it all but really don’t want to pay for it.  The bill came due in the 2000s and this is why we now find our nation moving backwards and many households are struggling to get by.  The major difference this time is that households have taken their austerity pill while the connected banks have taken on trillions of dollars of bailouts and continue to make money by socializing their defeats and privatizing their ill-gotten gains.
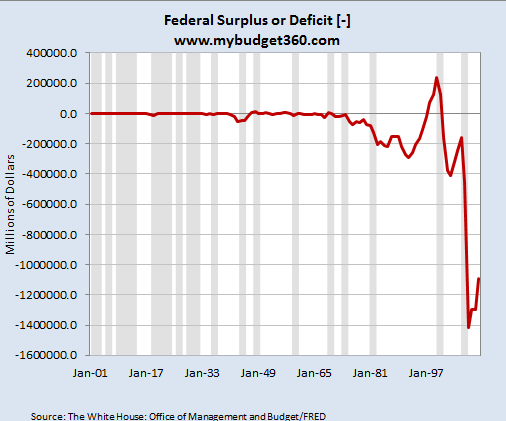
We are running incredible deficits:
fed deficits
This is a generational pattern here since this started in the 1970s.  The reason the US is able to do this is the gains that have occurred over time.  The foundation is strong but is getting eroded.  You can gamble more after being hot for many years.  Many Americans are now seeing the hidden costs to all of this in the form of household incomes going back to 1995 levels, 46 million Americans on food stamps, and the rising cost of many items.  In other words the bill is coming due.
There is a false sense of prosperity that comes from confusing access to debt with actual wealth.  No, the real wealth in this country is largely aggregated in a few hands.  These surveys showing that Americans barely have enough to get by with one missed paycheck show a deeper issue at hand.  Many are being pushed into a low wage capitalism system.  Spending this much via banking bailouts, gifts to the too big to fail banks, and the Fed making it cheaper for people to borrow simply pushes the bill out further into the future.
Spending money you do not have is not a wise financial decision.  If you pause for a second and think about it there is logic behind this.  Yet voodoo finance and other nonsense has convinced many in the public to be like zombie hamsters and continue spending even if they are unable to support this with their declining disposable income.  The media for the most part is like a Valium pill keeping people calm enough with their reality TV and iPhones to stay occupied.  Otherwise people would realize that something is awry when half your country is nearly broke. 

Real federal deficit dwarfs official tally

USA Today
May 27, 2012


The typical American household would have paid nearly all of its income in taxes last year to balance the budget if the government used standard accounting rules to compute the deficit, a USA TODAY analysis finds.


Under those accounting practices, the government ran red ink last year equal to $42,054 per household — nearly four times the official number reported under unique rules set by Congress.
A U.S. household's median income is $49,445, the Census reports.
The big difference between the official deficit and standard accounting: Congress exempts itself from including the cost of promised retirement benefits. Yet companies, states and local governments must include retirement commitments in financial statements, as required by federal law and private boards that set accounting rules.
The deficit was $5 trillion last year under those rules. The official number was $1.3 trillion. Liabilities for Social Security, Medicare and other retirement programs rose by $3.7 trillion in 2011, according to government actuaries, but the amount was not registered on the government's books.

Contrasting deficits

The federal government calculates the deficit in a way that makes the number smaller than if standard accounting rules were followed (in trillions).
Sources: USA TODAY research; Congressional Budget Office
Deficits are a major issue in this year's presidential campaign, but USA TODAY has calculated federal finances under accounting rules since 2004 and found no correlation between fluctuations in the deficit and which party ran Congress or the White House.
Key findings:
•Social Security had the biggest financial slide. The government would need $22.2 trillion today, set aside and earning interest, to cover benefits promised to current workers and retirees beyond what taxes will cover. That's $9.5 trillion more than was needed in 2004.
•Deficits from 2004 to 2011 would be six times the official total of $5.6 trillion reported.
•Federal debt and retiree commitments equal $561,254 per household. By contrast, an average household owes a combined $116,057 for mortgages, car loans and other debts.
"By law, the federal government can't tell the truth," says accountant Sheila Weinberg of the Chicago-based Institute for Truth in Accounting.

Who will pay for the massive US public debt? 30 percent of those with incomes above $10 million audited.

MyBudget360
May 18, 2012


Now that tax seasons is mostly finished for your average American and people can exhale and take a breather, some interesting data is released by the IRS.  Audit data is fascinating because it highlights that in terms of those getting an audit, the more you make the more likely you are to be audited.  It is useful to get a sense of how this plays out.  The IRS is unlikely to audit the average American making $25,000 a year because in reality, the cost and return of going after this group is so minimal.  As the famous bank robber Willie Sutton once replied to a reporter as to why he robbed banks, “because that’s where the money is.”  The government is running lean and as many of you know, carrying over a $15 trillion in public debt is starting to become a burden.  Debt ceiling talks are already out in the open as if we are already preemptively ready to spend more money we don’t have.  Ultimately all Americans will need to shoulder some piece of this debt via cuts or tax increases and that is the painful reality.
IRS audit data
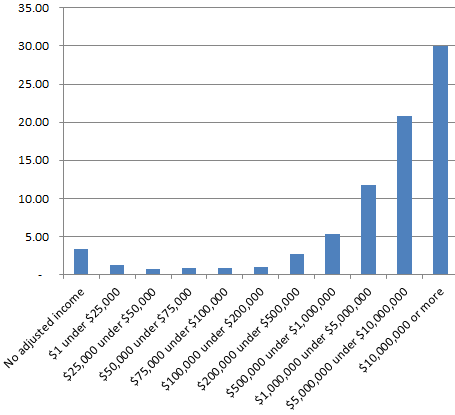
The IRS data is fascinating in terms of where they focus the large portion of their audits:
Individual Income Tax Returns Examined by Size of Adjusted Gross Income
Source:  Sober Look
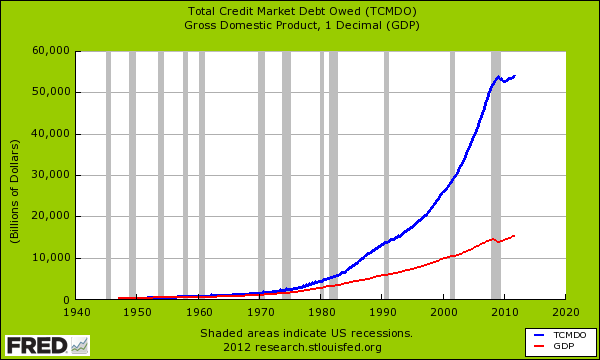
You’ll notice that once a $200,000 income is hit, the risk of being audited increases.  I also found it interesting that those reporting no adjusted income had a higher chance of being audited than those who made between $25,000 and $500,000.  This is probably another group that will show up on the radar.  However, those with incomes of $10 million or more have a 30 percent chance of being audited.  Yet as we know many Americans are simply struggling to get by with a per capita income of $25,000.  Our total credit market debt is simply off the charts and over three times annual GDP:
total-credit-market-debt-owed
Some serious challenges are coming online in the near future:
-1.  Unemployment benefits are phasing out and expiring for many
-2.  2001 and 2003 tax cuts set to expire
-3.  The debt limit will be reached again by the end of the year
-4.  Payroll tax cut will expire and increase from 4.2% to 6.2%
-5.  AMT will drop from $74,000 or higher to $45,000 or higher.  This will make it harder for middle class families to use deduction in effect creating a tax increase
Many purists would argue that we either go full on tax increases or full on cuts.  The reality is, the economy is incredibly weak.  Most of the economy is still fueled by subsidies via home owner mortgage interest deductions, bailout funds to banks, government backed student loans, food stamps, and unemployment insurance.  In other words, transfer payments are holding many people from full on economic disaster.  For example, 1 out of 3 retirees relies on Social Security for most of their post-work income.