Showing posts with label Debt. Show all posts

Price of Meat ,Poultry, Fish, and Eggs Goes Higher

CNS News
January 16, 2015

(CNSNews.com) -- Despite a decline in the overall Consumer Price Index (CPI) in December, the food index increased and the price index for meats, poultry, fish and eggs hit a record high, according to data released todayfrom the Bureau of Labor Statistics (BLS).
food
A basket of grocery goods. (AP)
According to the BLS, “The Consumer Price Index for All Urban Consumers (CPI-U) declined 0.4 percent in December on a seasonally adjusted basis. Over the last 12 months, the all items index increased 0.8 percent before seasonal adjustment.”
“The gasoline index continued to fall sharply, declining 9.4 percent and leading to the decrease in the seasonally adjusted all items index,” said the BLS.
“The fuel oil index also fell sharply, and the energy index posted its largest one-month decline since December 2008, although the indexes for natural gas and for electricity both increased,” said the BLS.
“The food index, in contrast, rose 0.3 percent, its largest increase since September.”
meat
(AP Photo)
“The food index rose 0.3 percent in December after a 0.2 percent increase in November,” stated the BLS. “The index for meats, poultry, fish, and eggs increased 0.3 percent as the index for beef and veal continued to rise, advancing 0.7 percent.”
In addition to rising 0.3 percent over the month, the index for meats, poultry, fish and eggs also hit a record high in December.
In January 1967, when the BLS started tracking this measure, the index for meats, poultry, fish, and eggs was 38.1. As of last December 2013, it was 239.151. In November 2014 it hit 260.247. And in December 2014 it hit a record high of 261.002, an increase of 9.1 percent in one year.
The price of ground beef, which hit a record high in November of $4.201, declined in December to $4.156.
While the price of beef declined, the price of fresh whole chicken per pound increased 0.5 percent, and grade A eggs hit a record high price.
eggs
(AP Photo)
In January 1980, when the BLS started tracking the price of this commodity, Grade A eggs cost $0.879 per pound. By this December 2014, Grade A eggs cost $2.21 per pound. A decade ago, in December 2004, Grade A eggs cost $1.199 a pound. Since then, the price has increased 84.3%.
Each month, the BLS employs data collectors to visit thousands of retail stores all over the United States to obtain information on the prices of thousands of items to measure changes for the Consumer Price Index (CPI). The CPI is simply the average change over time in prices paid by consumers for a market basket of goods and services.
The business and economic reporting of CNSNews.com is funded in part with a gift made in memory of Dr. Keith C. Wold.

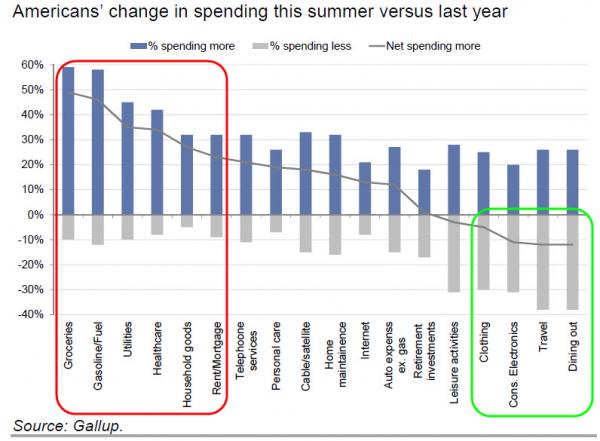
Inflation where it matters: Close to 50 percent of Americans indicate spending more on groceries and fuel this summer. Nearly one third indicate more spending on rent and mortgage payments.

MyBudget360
July 22, 2014

The stock market continues to move upwards ambivalent to economic indicators and the reality that inflation is permeating throughout our economy. The Fed continues to point at CPI as evidence that inflation remains subdued and this gives them the motivation to move forward with monetary policies that we have never embarked upon. We are already getting a taste of the bigger consequences including a growing low wage labor force. A recent Gallup survey found that Americans are spending more money on items that actually matter and items that consume a large portion of a household’s budget. This is key here in understanding the nature of inflation. Items like housing, healthcare, food, and energy make up a large portion of spending. Yet the Fed looks at other items that consume a small part of a household’s budget and balance out the overall picture. What you get is a massive understating of inflation and a stock market heavily juiced on easy money.Large pools of money are chasing real assets and crowding out regular Americans from the market.
Where inflation matters
It is interesting to see how people react to a constant feed of distorted information. The message is clear and it is one that is underplaying inflation. The tone set by the Fed is one in which monetary easing should continue to go on because inflation is simply not happening in the real economy. This could not be further from the truth.
Looking at the Gallup survey, you can find that Americans are spending more on the items that already consume a large part of their budgets:
Inflation
Source: Gallup, GS
The data?
-Half of Americans indicate they are spending more this year on groceries
-Over 40 percent indicate they are spending more on gas/fuel
-Over 35 percent indicate more is being spent on utilities
-Roughly 35 percent indicate more spending on healthcare
-Nearly 30 percent indicate spending more on rent/mortgage payments
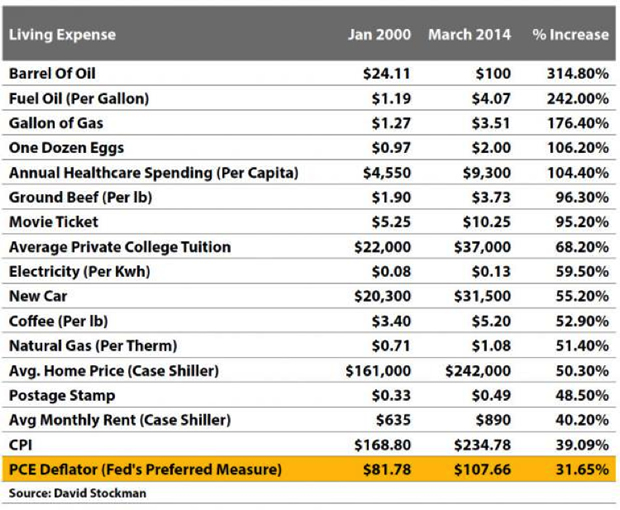
Does this seem like a market where inflation is actually muted? The Fed continues to mention what little inflation is out there is merely background noise like a cricket in the night. The above survey completely shatters that reality. Americans are spending more on items that actually matter and consume a large portion of their household income. Take a look at this data:
costoflivingxpenses-7-1-14
You will find that inflation is very much a real thing if we go back to 2000. A gallon of gas is up 176 percent since 2000. Ground beef is up 96 percent. Your typical college tuition is up 68 percent. A new car will now cost you 55 percent more than it would have in 2000. Your average home is now up 50 percent even though we went through the biggest housing bubble our nation has faced (largely driven by cheap and dangerous banking policy). Yet the overall CPI is only registering a 39 percent increase. The Fed looks at the PCE Deflator and this is only up 31 percent. So it is no surprise why the Fed has aggressively ramped up monetary policy.
Yet many people feel that as long as they can service their debt, all is well. They continue to listen to the mainstream press that rarely discusses incomes or inflation. So in the end, this information is largely left unexamined and many walk through life as financial zombies. Yet people are feeling the pinch and this is because monetizing debt and bailing out banks does have real world consequences. The end result is higher prices for those actually working in the real economy versus speculating in the financial sector. Since low wage jobs are becoming the norm, things are simply going to feel more expensive because they are. Inflation is hitting where it matters.

THE UNITED STATES OF DEBT: TOTAL DEBT IN AMERICA HITS A NEW RECORD HIGH OF NEARLY 60 TRILLION DOLLARS

Economic Collapse
June 16, 2014

What would you say if I told you that Americans are nearly 60 TRILLION dollars in debt?

What would you say if I told you that Americans are nearly 60 TRILLION dollars in debt?  Well, it is true.  When you total up all forms of debt including government debt, business debt, mortgage debt and consumer debt, we are 59.4 trillion dollars in debt.  That is an amount of money so large that it is difficult to describe it with words.  For example, if you were alive when Jesus Christ was born and you had spent 80 million dollars every single day since then, you still would not have spent 59.4 trillion dollars by now.  And most of this debt has been accumulated in recent decades.  If you go back 40 years ago, total debt in America was sitting at about 2.2 trillion dollars.  Somehow over the past four decades we have allowed the total amount of debt in the United States to get approximately 27 times larger.  This is utter insanity, and anyone that thinks this is sustainable is completely deluded.  We are living in the greatest debt bubble of all time, and there is no way that this is going to end well.  Just check out the chart…
Total Debt
When the last recession hit, total debt in America actually started going down for a short period of time.
But then the Federal Reserve and our politicians in Washington worked feverishly to reinflate the bubble and they assured everyone that everything was going to be just fine.  So Americans once again resorted to their free spending ways, and now total debt in the United States is rising at almost the same trajectory as before and has hit a new all-time record high.
We see a similar thing when we look at a chart for consumer debt in America…
Total Consumer Credit
For a while after the recession it was trendy to cut up your credit cards and get out of debt.
But that fad wore off rather quickly, didn’t it?
It is almost as if 2008 never happened.  We are making the same mistakes with debt that we did before.
As I noted recently, total consumer credit in the U.S. has risen by 22 percent over the past three years alone, and at this point 56 percent of all Americans have a subprime credit rating.
And have you noticed that a lot of people are not afraid to extend themselves in order to buy shiny new vehicles these days?
During the first quarter 0f this year, the size of the average vehicle loan soared to a new all-time record high of $27,612.
Five years ago, that number was just $24,174.
And as I noted in one recent article, the size of the average monthly car payment in this country is now up to $474.
That is practically a mortgage payment.
Speaking of mortgage payments, even though home sales have been falling and the rate of homeownership in the United States is the lowest that it has been in 19 years, a very large percentage of those who own homes are still overextended.
In fact, one recent survey discovered that a whopping 52 percent of Americans cannot even afford the house that they are living in right now.
At the same time, an increasing number of Americans are acting as if the last financial crisis never happened and are treating their homes like piggy banks.   Home equity loans are soaring again, and when the next great crisis strikes a lot of those people are going to end up getting into a lot of financial trouble.
There has been much written about what is wrong with the housing industry, but the truth is that home prices are still way too high and young adults cannot afford to purchase homes because they are already loaded down by huge amounts of debt even before they get to the point where they are ready to buy.
In fact, a newly released survey found that 47 percent of millennials are spending at least half of their paychecks on paying off debt…
Four in 10 millennials say they are “overwhelmed” by their debt — nearly double the number of baby boomers who feel that way, according to a Wells Fargo survey of more than 1,600 millennials between 22 and 33 years old, and 1,500 baby boomers between 49 and 59 years old.
To try to get out from underneath it, 47% said they spend at least half of their monthly paychecks on paying off their debts.
When I read that I was absolutely astounded.
Of course the biggest debt that many young adults are facing is student loan debt.  According to the Federal Reserve, there is now more than 1.2 trillion dollars of student loan debt in this country, and about 124 billion dollars of that total is more than 90 days delinquent.
What we have done to our young people is shameful.  We have encouraged them to sign up for a lifetime of debt slavery before they even understand what life is all about.  The following is an excerpt from my previous article entitled “Is College A Waste Of Time And Money?“…
In America today, approximately two-thirds of all college students graduate with student loan debt, and the average debt level has been steadily rising.  In fact, one study found that “70 percent of the class of 2013 is graduating with college-related debt – averaging $35,200 – including federal, state and private loans, as well as debt owed to family and accumulated through credit cards.”
That would be bad enough if most of these students were getting decent jobs that enabled them to service that debt.
But unfortunately, that is often not the case.  It has been estimated that about half of all recent college graduates are working jobs that do not even require a college degree.
Considering what you just read, is it a surprise that half of all college graduates in America are still financially dependent on their parents when they are two years out of college?
According to the U.S. Census Bureau, only 36 percent of all Americans under the age of 35 own a home at this point.  That is the lowest level that has ever been recorded.
And we are passing on to our young people the largest single debt in all of human history.  Weighing in at 17.5 trillion dollars, the U.S. national debt is a colossal behemoth.  And almost all of that debt has been accumulated over the past 40 years.  In fact, 40 years ago the U.S. national debt was less than half a trillion dollars.
But this is just the beginning.  As the Baby Boomer “demographic tsunami” washes through our economy, we are going to be facing a wave of red ink unlike anything we have ever contemplated before.
Meanwhile, the rest of the planet is drowning in debt as well.
As I wrote about the other day, the total amount of debt in the world has risen to a new all-time record high of $223,300,000,000,000.
Our “leaders” keep acting as if these debt levels can keep growing much faster than the overall level of economic growth indefinitely.
But anyone with even a shred of common sense knows that you can’t spend more money that you bring in forever.
At some point, a day of reckoning arrives.
2008 should have been a major wake up call that resulted in massive changes.  But instead, our leaders just patched up the old system and reinflated the old bubbles so that they are now even larger than they were before.
They assure us that they know exactly what they are doing and that everything will be just fine.
Unfortunately, they are dead wrong.

The Real Unemployment Rate: In 20% Of American Families, EVERYONE Is Unemployed

Michael Snyder
American Dream
April 29, 2014
According to shocking new numbers that were just released by the Bureau of Labor Statistics, 20 percent of American families do not have a single person that is working. 
Image: Family (YouTube).
So when someone tries to tell you that the unemployment rate in the United States is about 7 percent, you should just laugh.  One-fifth of the families in the entire country do not have a single member with a job.  That is absolutely astonishing.  How can a family survive if nobody is making any money?  Well, the answer to that question is actually quite easy.  There is a reason why government dependence has reached epidemic levels in the United States.  Without enough jobs, tens of millions of additional Americans have been forced to reach out to the government for help.  At this point, if you can believe it, the number of Americans getting money or benefits from the federal government each month exceeds the number of full-time workers in the private sector by more than 60 million.
When I was growing up, it seemed like anyone that was willing to work hard could find a good paying job.  But now that has all changed.  At this point, 20 percent of all the families in the entire country do not have a single member that has a job.  That includes fathers, mothers and children.  The following is how CNSNews.com broke down the numbers…
A family, as defined by the BLS, is a group of two or more people who live together and who are related by birth, adoption or marriage. In 2013, there were 80,445,000 families in the United States and in 16,127,000—or 20 percent–no one had a job.
To be honest, these really are Great Depression-type numbers.  But over the years “unemployment” has been redefined so many times that it doesn’t mean the same thing that it once did.  The government tells us that the official unemployment rate is about 7 percent, but that number is almost meaningless at this point.
A number that I find much more useful is the employment-population ratio.  According to the employment-population ratio, the percentage of working age Americans that actually have a job has been below 59 percent for more than four years in a row…
Employment Population Ratio 2014
That means that more than 41 percent of all working age Americans do not have a job.
When people can’t take care of themselves, it becomes necessary for the government to take care of them.  And what we have seen in recent years is government dependence soar to unprecedented levels.  In fact, welfare spending and entitlement payments now make up 69 percent of the entire federal budget.  For much more on this, please see my previous article entitled “18 Stats That Prove That Government Dependence Has Reached Epidemic Levels“.
And what is even more frightening is that more families are falling out of the middle class every single day.  As a recent CNN article explained, approximately one-third of all U.S. households are living “hand-to-mouth”.  In other words, they are constantly living on the edge of financial disaster…
About one-third of American households live “hand-to-mouth,” meaning that they spend all their paychecks. But what surprised the study authors is that 66% of these families are middle class, with a median income of $41,000. While they don’t have liquid assets, such as savings accounts or mutual fund holdings, they do have homes and retirement accounts, with a median net worth of $41,000.
“We don’t expect them to be living paycheck to paycheck,” said Greg Kaplan, study co-author and assistant professor of economics at Princeton University.
The American Dream is rapidly becoming an American nightmare.
When I was growing up, I lived in a pretty typical middle class neighborhood.  Everyone had a nice home, a couple of cars and could go on vacation during the summer.  I don’t remember ever hearing of anyone using food stamps or going to a food bank.  In fact, I can’t even remember anyone having a parent that was unemployed.  If someone did leave a job, it was usually quite easy to find another one.
But today, the middle class is being ripped to shreds and according to one new report there are 49 million Americans that are dealing with food insecurity in 2014.
How can anyone not see what is happening to us?  America is in the midst of a long-term economic decline, but the mainstream media and most of our politicians seem to think that things are better than ever.  They continue to try to convince us that “business as usual” is the right path to take.
But one-fifth of the families in the entire nation are already totally unemployed.
At what point will we finally admit that what we are doing right now is simply not working?
30 percent of all families unemployed?
40 percent?
50 percent?
If we stay on the road that we are on now, things are going to continue to get worse.  Millions more jobs will be shipped overseas, millions more jobs will be replaced by technology and crippling government regulations will kill millions more jobs.  The middle class will continue to shrink and government dependence will continue to rise.
Most people just want to work hard, put food on the table, pay their mortgages and provide a nice life for their families.
But the percentage of Americans that are successfully able to do that just keeps getting smaller.
Wake up America.
Your middle class is dying.

CBO: Debt to Reach 80% of GDP in a Decade

News Max
February 23, 2014

An ominous new report from the Congressional Budget Office paints a bleak picture for America's future, projecting that entitlement spending will send the federal deficit soaring beyond previous estimates.
Federal entitlement spending is projected to rise at an average annual rate of 5.9 percent over the coming decade, increasing spending from $2.1 trillion this year to $3.7 trillion in 2024.

The CBO also projects that the federal budget deficit will rise to more than 4 percent of GDP in the latter part of the coming decade. From 2015 to 2024, the cumulative deficit will reach $7.9 trillion, $1 trillion higher than previously projected.

That would push debt held by the public to nearly 80 percent of GDP in 2024, "far above the post-war norm for the United States and perilously close to levels from which it is hard to recover," James C. Capretta noted in an article published by the Manhattan Institute's Economic Policies for the 21st Century.
But the actual economic situation could be far worse. The CBO projections assume an average annual growth rate in discretionary spending of only 1.8 percent. This would likely take defense spending as a percentage of GDP down to levels "not seen in the post-war era — at a time when global conflicts and potential threats are clearly on the rise," observed Capretta, a senior fellow at the Ethics & Public Policy Center and a visiting fellow at the American Enterprise Institute.

Looking further into the future, deficits are projected to rise even more sharply in years beyond the coming decade due to an aging population and healthcare inflation. The CBO expects debt held by the public to reach 190 percent of GDP by 2038. And that's assuming the nation will not experience another serious economic downturn.

What's more, the CBO projections don't include data on total state debt, which the Insider Report last week disclosed has already topped $5 trillion.

"At the beginning of the Obama presidency, the administration convened a fiscal responsibility summit during which there was a lot of talk about the need to finally address the ticking time bomb of runaway entitlement spending," Capretta wrote. "Suffice it to say that, in year 6 of the Obama presidency, people are not holding their breath that a breakthrough on entitlements is imminent."

He concluded: "It would be far better to take action now and head off the crisis before it ever happens than to wait for the crisis to hit and then attempt to scale back benefit commitments."

CBO: Obamacare’s 10-Year Costs Will Now Eclipse $2 Trillion

The Weekly Standard
February 17, 2014

LOG.WSmith.16-11.ObamacareLogo
Remember back when the Democrats tried to sell Obamacare to a skeptical citizenry as health care “reform” that would cost “only” $848 billion—far less than a trillion—over a decade?  Indeed, that was the alleged 10-year gross cost of Obamacare’s coverage provisions, according to the Congressional Budget Office (see Table 3), when Harry Reid, Mark Pryor, Kay Hagan, Mary Landrieu, Al Franken, Mark Udall, Jeanne Shaheen, Mark Begich, Mark Warner, and the rest of the Democrats rammed President Obama’s signature legislation through the Senate on Christmas Eve without a single Republican vote.  That 12-digit price-tag was widely cited by the New York Times and other sympathetic outlets, who treated it as gospel, even as conservatives observed that it was clearly a sham number.
Well, now the CBO is out with a new report on Obamacare’s costs, and—sure enough—its 10-year price-tag now eclipses $2 trillion.  To be more exact, the CBO now projects (see Table B-1) that the 10-year gross cost of Obamacare’s coverage provisions will be a cool $2,004,000,000,000.00. 

Debt Up $6.666 Trillion Under Obama

CNS News
February 4, 2014

(CNSNews.com) - The debt of the U.S. government has increased $6.666 trillion since President Barack Obama took office on Jan. 20, 2009, according to the latest numbers released by the Treasury Department.
When President Obama was first inaugurated on Jan. 20, 2009, the debt of the U.S. government was $10,626,877,048,913.08, according to the Treasury Department’s Bureau of the Public Debt. As of Jan. 31, 2014, the latest day reported, the debt was $17,293,019,654,983.61—an increase of $6,666,142,606,070.53 since Obama’s first inauguration.
The total debt of the United States did not exceed $6.666 trillion until July 2003. In the little more than five years of the Obama presidency, the U.S. has accumulated as much new debt as it did in it’s first 227 years.
$6.666 Trillion Debt
The business and economic reporting of CNSNews.com is funded in part with a gift made in memory of Dr. Keith C. Wold.
Quantitative Easing has become heroine to the financial markets: Federal Reserve balance sheet hits $4 trillion this week.

MyBudget360
December 16, 2013

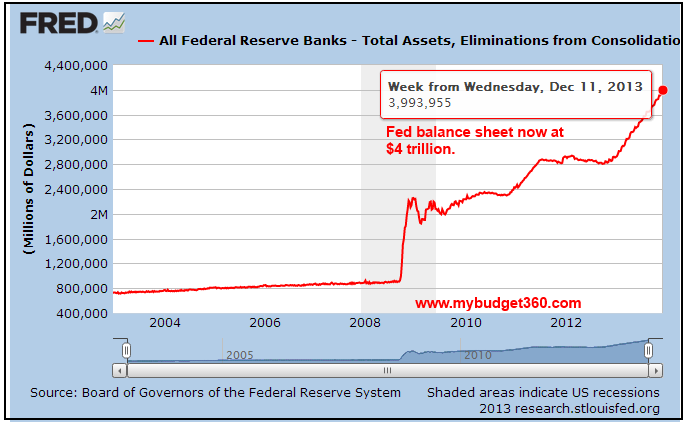
Addiction is never an easy battle to overcome.  This also applies to easy money addiction that is now part of the Quantitative Easing economy.  The Fed’s extraordinary measures are now appearing to be more permanent measures.  Every time the whispers of tapering are made the markets respond accordingly signifying that the stock market is fully addicted on easy money.  There is really no backing out of QE without some sort of pain.  Any addict pulling themselves away from a drug suffers some brief or long period of withdrawal.  Yet the long-term benefits are obvious.  In this case, the Fed is not only avoiding tapering but getting more aggressive in their QE heroine.  This week, the Fed’s balance sheet crossed the $4 trillion barrier.  Of course few people pay attention to the Fed’s balance sheet but the fact that the Fed has created a second housing mania fueled by investor money is startling.
QE forever
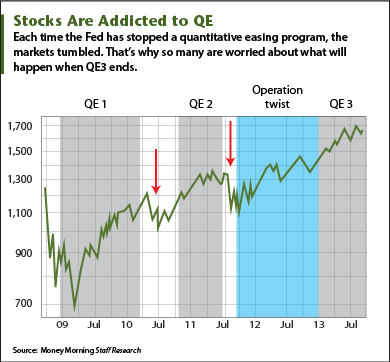
It is interesting that each time the hint of a taper was made the market responded by pulling back.  The markets are fully addicted to this low rate environment brought on by the Fed buying up long-term MBS on the cheap.  Who in the world would take on a 4 percent mortgage in this kind of market?  Apparently only the Fed.  So it is no surprise that the markets respond with pain each time the QE taper is announced:
When-QE-ends
Source:  Money Morning
It is fairly clear that pulling back on QE will have an impact on stocks. The entire financial edifice is now building off of the assumption that QE will last forever.  This has created deep distortions in wealth and has also created a secondary housing mania where big funds are rushing out to buy real assets with artificially low rates.
It is comical to hear that the Fed is tapering because looking at the Fed balance sheet we see absolutely no signs of any sort of tapering:
fed balance sheet
To the contrary, the Fed has become more aggressive in buying up MBS via their QE operations.  The Fed is now essentially the mortgage market.  In spite of this poor allocation of resources, wealth inequality in the US has only become more pronounced.  As we have highlighted before most Americans have very little invested in the stock market so the gains here are of little consequence to the vast majority.  Companies have used the economy to cut wages and also to slam employee benefits.  Behind the scenes however high level executives especially in the financial industry have used easy money handouts from the Fed to lever up once again in the real economy.
Don’t forget the debt
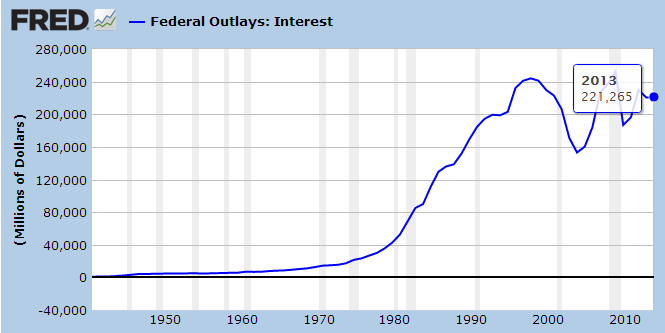
We are now paying a substantial sum in interest payments on our debt:
fed interest costs on debt
The only thing keeping things down is the low rate we are able to garner around the world.  The Fed is aware of this and realizes any sizeable moves in interest rates will cause a dramatic rise in interest payments on debt.  Better to inflate away our debt so long as we can find a market for this.  Yet that is the problem with QE since the Fed is essentially the only player.  There is virtually no market for 30 year mortgage rates at current price levels.  The market is fully addicted on QE.
Getting off QE heroine does not look like it will happen.  So why the constant discussions of tapering?  The Fed is a giant confidence game and many are starting to realize this.  Banks understand that any sort of unwind will impact the stock market so better to chase yields in real assets and crowd out regular households.  This is why inequality keeps getting worse in the US in spite of the stock market being near a record high.  The financial industry is fully addicted to this QE heroine and will say anything to keep their pusher providing this easy money.  $4 trillion will not be the only milestone that is crossed even though the taper is always being mentioned.

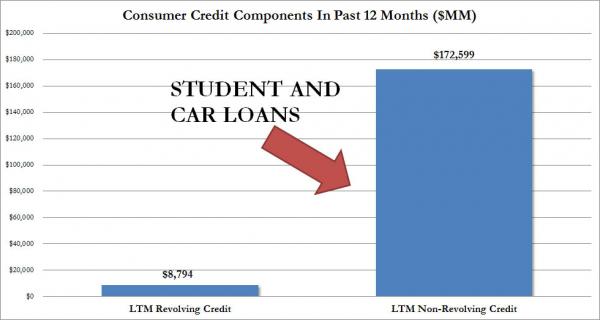
Depreciating cars and expensive diplomas fueled by easy debt: 95 percent of consumer debt growth in past 12 months from cars and student loans.

MyBudget360
December 7, 2013

New data from the Federal Reservecontinues to highlight a reemergence of debt based consumer spending.  Americans are largely buying stuff they can’t afford with money they don’t have.  The Fed’s consumer credit report highlights a troubling trend.  Over the last 12 months 95 percent of all consumer debt growth has come from people buying cars and young Americans going deep into debt to pursue a college education.  A car quickly loses its value once it drives off the lot and many college degrees are massively over valued only being supported by easy financing.  This is a disturbing trend, even more troubling than the last debt fueled bubble.  One can argue with housing that at least people are getting an asset that generally rises with inflation.  But a car?  A for-profit degree?  The debt juice is now flowing once again.
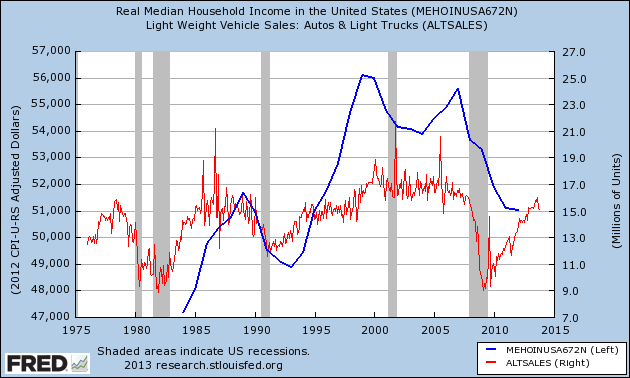
Buying cars while incomes drop
If we look at incomes and car sales we find that households are simply purchasing cars by borrowing from the future:
auto-sales-and-income
The Fed consumer credit report merely confirms what we suspect.  The dramatic jump in auto buying isn’t coming because households are suddenly wealthier but because consumer debt is booming once again.  Cars are not “good” assets and unfortunately, many Americans need to grow their net worth but adding a depreciating vehicle on your balance sheet isn’t exactly a smart plan.
The consumer credit report shows that 95 percent of consumer debt growth in the last 12 months has come in the form of auto loans and student debt:
Nonrevolving LTM October_0
Source:  ZeroHedge, Fed
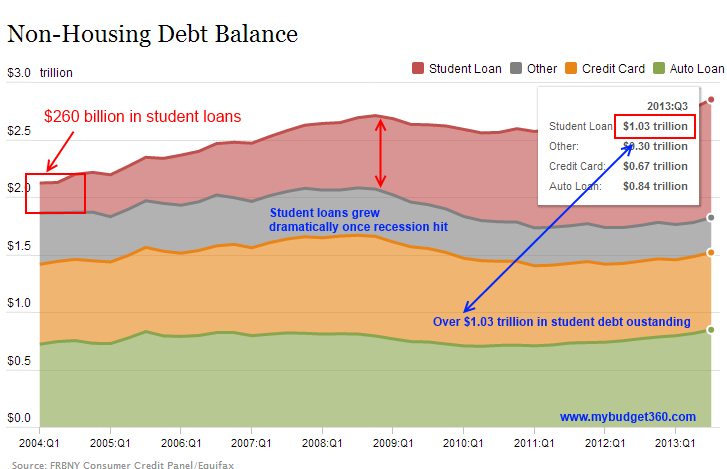
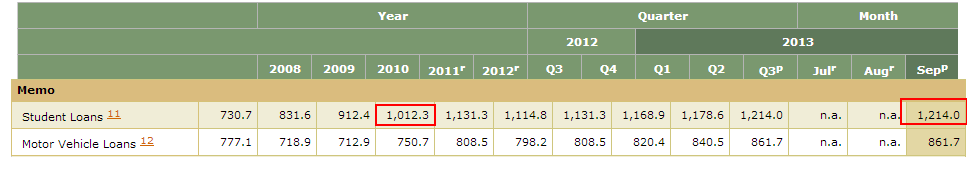
When you factor in the reality that student debt is now the largest debt market outside of mortgage debt, you realize that many young Americans are saddling their lives in the red even before they begin their working careers.
Total student debt in the US is well over $1.2 trillion as measured by new Fed data:
student-loan-data
student-loans-higher-data
So we are now having another expansion completely based on easy access to debt.  For banks, this access never went away in the form of cheap money via the Fed.  The Fed’s balance sheet is now quickly approaching $4 trillion.  We are told that there is no inflation but real estate values are spiking at a rate last seen during the last bubble but household incomes are not going up.  Of course this time the price of real estate is being pushed up byWall Street investors.  At least in the last bubble, most Americans had access to mortgages, credit cards, and all other forms of cheap debt to party with Wall Street.  Today, it seems like consumers have the option of auto loans or student debt.  Good luck trying to buy a home in some of the hot markets where big money is battling it out over what little inventory is available.  Credit card rates are still very high even though banks have access to record low rates courtesy of Fed monetary policy.  The same policy that is pushing home prices up and keeping household incomes down.  The circle of monetary life.  Hakuna matata.
Of course the public by getting a little piece of the action suddenly is blinded by the scheme that is taking place.  As long as some grease is hitting their hands things are okay.  Just wait until this debt fueled bubble pops again.  Don’t expect the top 10 percent to bail you out (it’ll be the other way around yet again).  The message is, keep on buying those cars you can’t afford and keep going to college via massive student debt.

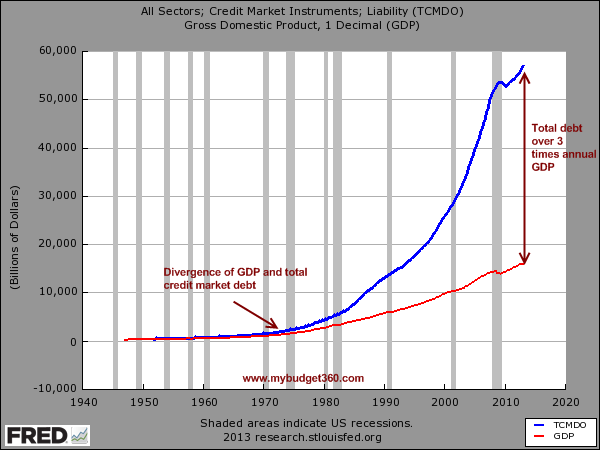
Has the US lost control on debt market growth? Unbridled debt expansion at the nucleus of rising debt inequality in the United States. US total credit market debt now over 3 times larger than annual GDP.

MyBudget360
July 4, 2013


There is one charge that can never be leveled against Americans and that would be that we somehow have an aversion to debt.  To the contrary, our love with debt has blossomed into a full blow addiction.  People confuse access to debt with actual real wealth.  However as the foreclosure crisis has taught millions, you really don’t own something fully until the debt is paid off.  The problem with this addiction is that we are now going deeper and deeper into a debt filled spiral.  The Federal Reservehas positioned us into a market where debt is necessary, but this debt has to come at an artificially low rate.  Any hint that rates will rise causes the market to quiver like a teenager at prom.  This is troubling because it is a sign of addiction and probably, a belief that there is no longer an out clause.  Anyone that has seen the show Intervention realizes how difficult it is to combat a serious addiction.  First, there needs to be an acknowledgment of a problem.  We are still steps away from recognizing this as an issue.
Has the US lost control of the debt market?
Historically, we are in some deep uncharted waters:
us debt and gdp
Starting in the 1970s, the total credit market debt owed and US GDP went hand and hand.  This was fairly common.  After this point, there has been a major divergence between the two as the above chart highlights.  All of this has accelerated in the 80s, 90s, and even the 2000s.  So today, we are in a position where total debts owed are three times more than annual GDP.  Keep in mind that these are payments that need to be made at some point in time.
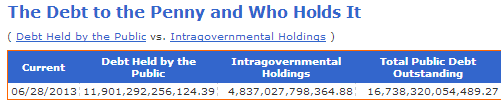
Total public debt itself is now larger than annual GDP:
us debt to penny
Source:  US Treasury
Total public debt now stands at $16.73 trillion.  What is fascinating is the psychology behind this.  People do realize that this will never be paid back right?  Who is going to pay this back?  Americans are back to record low savings rates.  Are we going to digitally print our way into economic prosperity?  The Federal Reserve seems to think so.
Yet multiple decades of this attitude has led us to this:
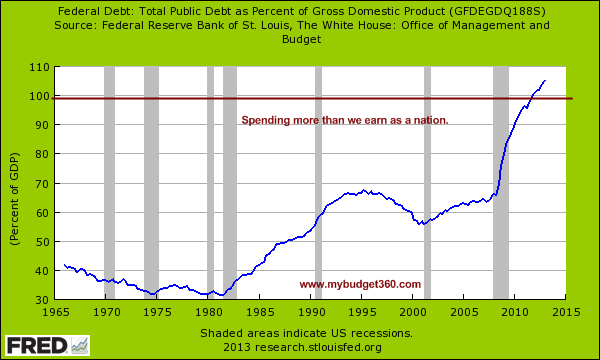
fed debt as a percent of gdp
For the first time in a generation total public debt is larger than our annual GDP.  We are spending more than we earn.  Keep in mind the last time we were in a similar position was during a time when the large part of the globe was at full-fledged war in the 1940s.  Building a solid credit reputation takes time.  Yet how long can we remain in a position where we continually spend more than we earn and simply fuel future spending on additional debt?
Consumption via debt
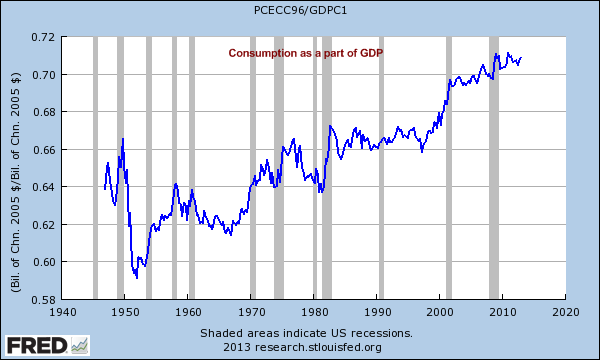
Study after study shows that many Americans simply do not save enough money.  Half of the country is literally living paycheck to paycheck.  Yet somehow, we are massively a consumption based economy:
consumption as a part of gdp
Consumption is still over 70 percent of our GDP.  Most of this is coming via access to debt.  Debt to purchase homes, student loans to pay for college, and easy access to debt for banks to speculate in global markets.  Yet in the middle of all this consuming and spending Americans are actually falling behind when it comes to building true wealth.
Punishing savers and growing inequality
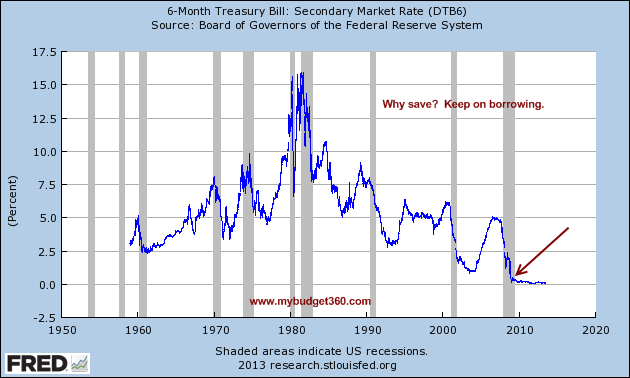
The Fed is fully aware that there is no turning back on this uncontrollable debt train.  Interest payments on our debt are growing at a hefty pace.  This is why the Fed has enlarged their balance sheet to $3.3 trillion merely to keep interest rates low on a variety of items (primarily loans to banks and mortgages that by the way, are issued by banks and linked into government backed MBS).  For savers, this has turned out to be a tough deal:
6-month tbill
This is a negative interest rate environment.  With inflation tracking at 2.5 to 3 percent annually you are losing money simply by saving it.  So the underlying incentive is to spend what you have today or risk losing value as inflation erodes your purchasing power.
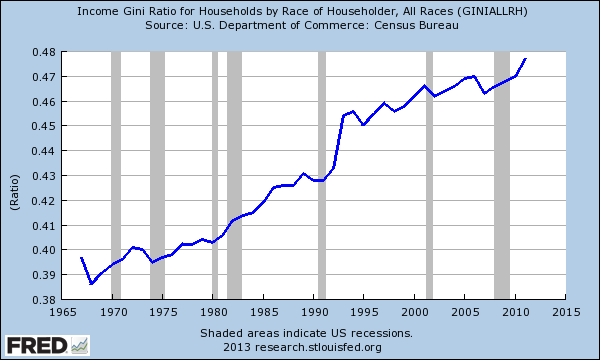
What this uncontrollable growth in debt has done has created the highest inequality in our nation since the Gilded Age:
gini us
This is how you can have 47+ million Americans on food stamps and a record high in the stock market at the same point in history.  This is how you can have 1 out of 3 Americans with no savings but the typical CEO makes 273 times what the average worker makes.  So why has this been the case?  Why is this massive expansion in debt causing so much more inequality?
First, you need to realize that most of the large amounts of debt are going to big banks.  Many of these banks have wealthy clients like hedge funds.  Many of these funds, are now funneling money back into the market by chasing rental properties for example.  Yet this low rate environment comes at a cost (depressed purchasing power, crowding out regular Americans, future debts to be paid, etc).  This easy access to money is also allowing Wall Street to leverage funding in speculating in global stock markets which don’t necessarily help Americans.  It clearly hasn’t helped when it comes to inequality or rising wages for the typical worker.  It also protects only a small portion of our population.  While inflation adjusted wages are back to 1995 levels, as the CEO wage highlights, a tiny segment is doing exceptionally well in this uncontrollable debt growth market.
As we initially said, access to debt in a debt based economy is similar to access to a large bank account.  If you can live in a multi-million dollar home courtesy of easy bank loans, you basically are living this lifestyle even if you are in deep debt.  You might not have enough for a European luxury car, but you can lease it.  This really is what the system is favoring.  Look at the T-Bill rate and tell me who is going to want to save especially when inflation is going to give you a negative rate?  So those with little to no savings (many Americans) are left in a paycheck to paycheck cycle losing purchasing power.  Those with access to the moresophisticated programs chained to debt, their leverage is increasing on the backs of the many.  If growing an economy was as simple as digitally printing money I think central banks would have been on that years ago.  Instead, it has become unfortunately a zero sum game where access to debt is used as a pawn to reshuffle real assets in the real economy to a smaller group of people (i.e., foreclose on homeowners, buy at fire sale prices, put it into a hedge fund, sell to Wall Street as a future income stream, rent it back to working Americans etc).  It is very likely that we have lost control of the debt markets and those suffering are the people with the least access to it.