Showing posts with label Unemployment. Show all posts

Trump Jobs Numbers Out: Unemployment at 17 year Low, 2.2 Million New Jobs Since Election, More Americans Working than Ever!

cnbc
December 8, 2017


President Trump’s Economy is Simply “On Fire”.

Job numbers released today through the end of November show an increase of 2.2 million jobs since last years election and an unemployment rate of 4.1 percent. After the same period under Obama, (4.8) million jobs were lost and unemployment skyrocketed to 9.9 percent!

President Trump’s economic results could arguably be the best all time. The stock market is the highest ever and jobs are being created by the thousands.
Jobs
According to data released today by the Bureau of Labor StatisticsPresident Trump added a projected 1.9 million jobs in the first eleven months of the year (January through November 2017) and 2.2 million jobs since last year’s election. 
The same cannot be said for President Obama’s first eleven months as he lost 4.8 million jobs. Obama was so bad at creating jobs that by the end of his second term he said that jobs were not coming back. This showed in his first eleven months in office because in every month the US lost jobs.
According to the Bureau of Labor Statistics, under President Trump more Americans are in the work force than ever before. Over 160 million Americans are working for the first time in US history. President Trump is working hard to bring good paying jobs back to the US and his efforts are showing historic results.  ADP reported 40,000 new manufacturing jobs in November.  This was the highest reported monthly amount of new manufacturing jobs in the history of their report!

Read the entire article

Fewest Jobless Claims Since 1973 Show Firm U.S. Job Market

Bloomberg Market
October 19, 2017

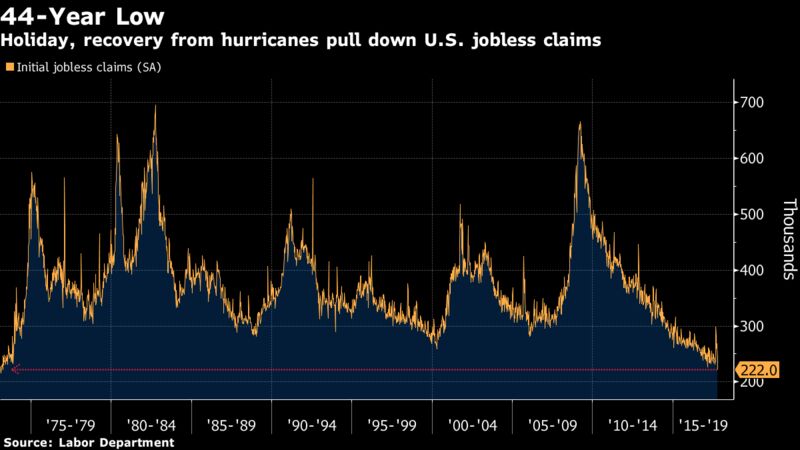
Filings for unemployment benefits plunged last week to the lowest level since 1973 as workers affected by hurricanes Harvey and Irma continued to return to their jobs, Labor Department figures showed Thursday.

The larger-than-projected decrease in claims probably reflected difficulty adjusting for the Columbus Day holiday. At the same time, the report showed further declines in claims in hurricane- affected states. The storms initially led to a spike in applications in Texas and the southeastern U.S. in late August and early September.
The latest period also encompasses the reporting week that the Labor Department surveys for its October employment figures. Claims are at the lowest level in more than four decades, indicating employers have little desire to cut staffing levels amid a shortage of qualified workers.

Other Details

  • Prior week’s reading was revised to 244,000 from 243,000
  • Unemployment rate among people eligible for benefits fell to 1.3 percent from 1.4 percent
  • Applications slumped in Florida, Texas, Georgia and Michigan
  • Claims were estimated only for the Virgin Islands last week, according to the Labor Department
— With assistance by Jordan Yadoo

Unemployment claims fall to lowest level in 43 years, despite hurricanes

Washington Examiner
October 12, 2017


The total number of laid-off workers receiving unemployment benefits fell to 1.89 million at the end of September, the Department of Labor reported Thursday, the lowest such mark in nearly 44 years.
And new claims for unemployment benefits dropped 15,000 to 243,000 in the first full week of October, according to the agency, as the job market bounces back from hurricane damage even faster than forecasters expected.
Low new jobless claims are a good sign. They indicate that layoffs are rare, and accordingly that job creation is strong.
Unemployment benefits are available for up to 26 weeks in most states. Fewer people are now receiving benefits of all duration than at any time since December of 1973, when the total workforce was much smaller. That is a reflection of the strength of the jobs market, and the availability of new positions for laid-off workers.
Prior to the landfall of Hurricanes Harvey, Irma, and Maria, claims had been running at ultra-low rates. With Texas and Florida now recovering, new claims again appear to be sinking to levels that indicate robust job creation. First-time claims in the states most affected by the storms are still high, but have fallen in recent weeks.
"The data suggest that payrolls will bounce back quickly after last month's hurricane-related weakness and that the underlying trend in employment growth remains strong -- more than strong enough to keep the unemployment rate declining," noted Jim O'Sullivan, chief U.S. economist for High-Frequency Economics.
Economists calculate that new claims below the 300,000 mark indicate that unemployment will remain stable or fall.
Good claims numbers, which are released weekly, are one of the factors that will reassure officials in the Trump administration and at the Federal Reserve that the jobs recovery is intact, even though the hurricanes generated net job losses in September.
Minutes from the Fed's September monetary policy meeting, released Wednesday, suggested that the central bank still sees the economy as healthy enough to justify raising rates again this year.

How Trump compares with Obama so far on jobs

CNN Money
October 6, 2017


President Donald Trump loves to talk about creating jobs, and now has more than a million jobs to point to.

With July's jobs report, employers have added a total of 1,074,000 jobs during Trump's first six full months in office.
That essentially matches the 1,084,000 jobs created during President Barack Obama's last six months in office. Both round to 1.1 million, and the 10,000 difference is well within the margin of error of the Labor Department estimate.
Of course, Trump's six-month record is far better than Obama's first six months, when 3.4 million jobs were lost. That's because Obama was sworn in during the worst economic downturn since the Great Depression, when the economy was hemorrhaging jobs.

The Elite Knew Mass Unemployment and Unrest Was Coming A Long Time Ago

Aaron Dykes
January 27, 2016


(But they did nothing to stop it.) The technocrats and robber barons have been steering the ship for some time now. 

The technology of the day has caught up to us sooner than anybody realized, and now robots and automation is destroying hundreds of millions of human jobs across the globe.

Entire sectors will no longer be employed, and desperate people will turn to riots, looting and unruly behavior. Some may even turn on the "Davos elite" and other ruling members of the oligarchy.

As the talking points of their latest discussions at Davos indicate, they are worried about the revolutionary potential as wave of mass unemployment prepares to hit. The ultra wealthy control more now than ever, as the Middle Class is completely destroyed and the struggling and poor turn to government for help.

Yet the scientists and technicians who unleashed Cybernetics brought it upon the population intentionally. 

Norbert Wiener, the foremost expert in this field, discusses the violent potential of technological revolution for jobs and economic survival. 

Truthstream Can Be Found Here:
Website: http://TruthstreamMedia.com
FB: http://Facebook.com/TruthstreamMedia
Twitter: @TruthstreamNews
Newsletter: http://eepurl.com/bbxcWX

New Year begins with record number of men not in the labor force: Those not in the labor force increased by 1.9 million last year while the labor force increased by only 1.1 million.

MyBudget360
January 4, 2016

The New Year begins with a record number of men not in the labor force.  Those “not in the labor force” remains at a record level and this cannot be explained away simply by shifting demographics.  Demographics alone is a convenient explanation for this large number but unfortunately only explains part of the large number of Americans not being included in the labor force.  We have many going to college but as it turns out, not all colleges and degrees are created equal although most universities charge premium tuition.  You also have many wanting a job but not being able to find one.  The end result is a large number of Americans floating around in the odd category of not being in the labor force. Roughly 94.5 million Americans are not in the labor force.  Of those, a large number are men.
Those not in the labor force starts the year at near record levels
The story of those not in the labor force was severely underreported in the last few years.  It is a vital component of our labor force since the headline unemployment rate is derived from the size of the total labor pool.  Policy decisions are based on this figure being accurate.
A record number of men are not in the labor force.  We have 38,151,000 men not in the labor force to start the year out based on BLS figures.
“(Breitbart) The participation rate for men was 68.6 percent, declining 0.1 percent from October’s level of 68.7 percent. The 68.6 percent participation rate is also arecord in a history that goes back as far as January 1948 — the earliest available participation data — when the participation rate for men was 85.2 percent.”
This is a record no matter how you slice it.  It might be useful to see how those not in the labor force grew in 2015:

Those not in the labor force grew by 1,920,000 in 2015, or by an average of 160,000 per month.  But let us now take a look at the actual civilian labor force:

This category only grew by 1,172,000 in 2015.  There is something going on here beyond older people retiring.  And the idea that people are retiring and doing well is a misnomer.  Most are living under the new retirement plan of working until you die since pensions have been guttedand most people have no money in their retirement plans.  This is a troubling result of turning over our government to financial profiteers that have raided the American workforce.
The rise in healthcare costs is going to put a burden on our older population that makes up the bulk of those not in the labor force.  The perfect example of this was the case of Martin Shkreli that ended up buying the rights for a unique lifesaving drug and jacking up prices by a ridiculous amount.  It wasn’t his company that did the research or found this new drug.  He merely was exploiting the system in a perverse way to his benefit.  He is simply one case of larger systemic issues.
Employment, income, and financial prosperity are the most important issues for Americans.  It is ironic that in 2008 the election was driven largely by the economy.  It is very likely to be driven again by the same thing now that it is official that the middle class is a minority.  Keep an eye out on the labor force participation rate.

The drop in the labor force is coming from prime-age Americans, not aging retirees: Examining the 94.6 million Americans not in the labor force.

My Budget 360
October 13, 2015

Those not in the labor force hit a record number in the last month.  While the mainstream press tries to spin it as a retirement trend, the reality is mostAmericans are too broke to retire.  The Atlanta Fed added some color to explain the big decline in labor force participation.  As it turns out, the decline is coming from structurally problematic areas.  We have many that are in the prime-age category (25 to 54 years of age) that simply say they don’t want a job.  There is also a big jump in those on disability beyond normal population growth.  And finally, we have a larger share of younger Americans going to college and loading up on mega amounts of student debt.  Another contributing factor that is nicely left out is that we have many older Americans continuing to work into old age because as we have mentioned, many older Americans are too broke to retire.  Let us look at the research more closely.
Not in the labor force and not wanting a job
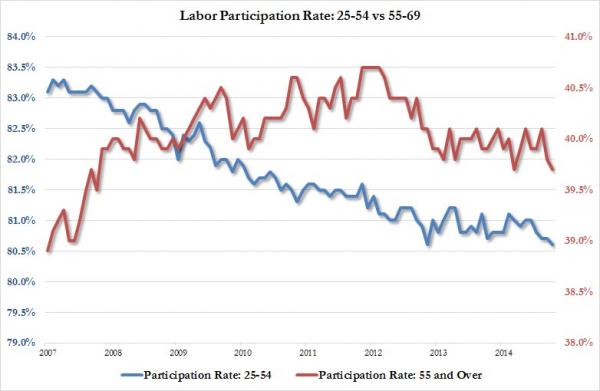
What is probably more troubling about the growth in the “not in the labor force” category is that a big jump has come from those 25 to 54 years of age.  This is the prime 30 year window when Americans typically work.  Yet something is dramatically shifting.  While the labor force participation rate of older Americans is holding steady, the rate of those in the prime-age range has collapsed.
The collapse of the labor force participation rate of those 25 to 54 years of age goes completely against the mainstream narrative.  Take a look at the trend:
LFP Sept_0
The group leading the way lower is coming from the group that should be working.  There is now a deeper attempt to explain this rate decline beyond the party line that Americans are simply getting older and are taking their non-existent retirement nest egg into the sunset.  That is not the case.  Half of elderly Americans would be out on the street without Social Security.
So what is driving the rate lower?
labor force participation rate
Source:  Atlanta Fed
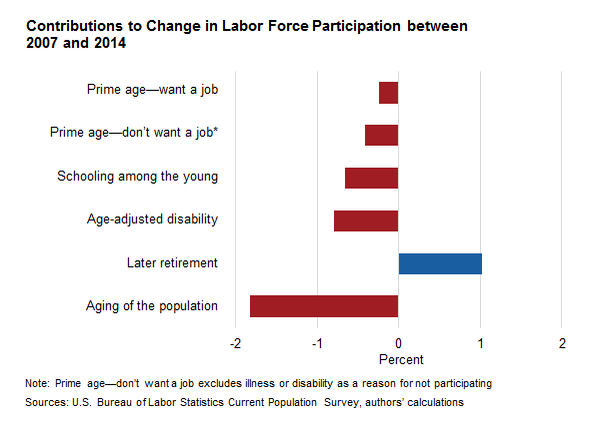
 “(Atlanta FedThe decrease in labor force participation among prime-age individuals has been driven mostly by the share who say they currently don’t want a job. As of December 2014, prime-age labor force participation was 2.4 percentage points below its prerecession average. Of that, 0.5 percentage point is accounted for by a higher share who indicate they currently want a job; 2 percentage points can be attributed to a higher share who say they currently don’t want a job.”
While the aging of the population is a factor (of course) there are other categories that are pushing the rate lower.  Let us go through them one by one:
Prime age – want a job:  This is the most obvious one.  These are people that want a job but are simply not counted.  Many of the long term unemployed fall in this category.
Prime-age –don’t want a job:  This is an odd category and accounts for a large number of Americans not in the labor force.  You can have folks that were so exhausted at looking for work that they simply have given up.
Schooling amount the young:  We have a record number of Americans in college and we also have $1.36 trillion in student debt outstanding.  While an education is important, what is the true value of going to college and how do you choose when there are nearly 5,000 universities and colleges?  What about those that get sucked into for-profit paper mills?
Age-adjusted disability:  What is interesting in this category is that we have seen a high jump in this group adjusting for population growth.  In other words, we are seeing more people claiming disability beyond the actual expected growth in the population.
Later retirement:  This one obviously goes against the media squawking.  More Americans are working later into life because they simply don’t have the means to retire.
Aging of the population:  This is the baby boomer party line here.
In other words, the big drop in labor force participation is happening largely because of weak performance in the economy, not old people cashing out and heading into Margaritaville.

Labor Force Participation Rate Hits All-Time Low for American Men

CNS News
October 5, 2015

Construction workers in New York. (AP File Photo)
(CNSNews.com) - The labor force participation rate for men hit an all-time low of 68.7 percent in September, the Labor Department's Bureau of Labor Statistics reported on Friday.
Last month, according to BLS, the male civilian non-institutional population, consisting of all males 16 or older who are not in the military or an institution was 121,365,000. Of those 121,365,000 men, 83,402,000 participated in the labor force by either holding a job or actively seeking one.
The 83,402,000 men who participated in the labor force in September equaled 68.7 percent of the 121,365,000 male civilian noninstitutional population. That is the lowest labor force participation rate for men since BLS began keeping the labor force participation rate in 1948.

In January 1948, 86.7 percent of men 16 and over were participating in the natilabor force. The participation rate for men was 72.4 percent when President Obama took office in 2009.
The labor force participation rate for women generally climbed in the first five decades after World War II. In January 1948, it was 32.0.  In April 200, it hit a peak of 60.3 percent. From this August to September, it dropped from 56.7 percent to 56.4 percent--a low not seen in 27 years.
In September, BLS says there were 129,960,000 women 16 and older in the nation's civilian noninstitutional population, and 73,313,000 of them participated by holding a job or actively looking for one.

In January 1948, the first year BLS recorded such data, 32 percent of women 16 and over were participating in the nations civilian labor force.

The participation rate for women 16 and over was 59.4 percent when President Obama took office. The highest it's been this year is 56.8 in both January and May.

The working few and the inverted pyramid of labor: 1 out of 3 Americans financially carry the other two-thirds.

MyBudget360
June 4, 2015

Last month a record 93,194,000 Americans were counted as not being in the labor force.  Counted might be the wrong word since this group is largely erased from any employment figures.  In fact, this is a large reason why the unemployment rate has fallen so dramatically.  Yet one grim financial reality remains.  That reality includes the fact that 1 out of 3 Americans is carrying the country financially by working in the private sector.  There needs to be a better balance and the working class is already getting slammed in this so-called recovery.  If things were so great, why is the battle cry for the 2016 election all about the working and middle class?  The stock market is near a peak.  Too bad most Americans own no stocks.  Housing values are rising.  Too bad more home purchases are going to investors versus single families.  Debt is more accessible.  Too bad it is for items like cars that depreciate immediately once the vehicle is driven off the lot.  The employment situation in the US is largely looking like an inverted pyramid.
1 out of 3
In baseball, getting a hit once out of every three at bats would be a good thing.  But life and the economy is not a baseball game.  Batting .300 is weak when it comes to employment.  So it is interesting that we give so little attention to the 93.2 million Americans that now make up the “not in the labor force” category.
The unemployment rate actually looks really good right now because the participation rate has fallen so dramatically.  The math is simple.  Count fewer people in the labor force and all of a sudden the unemployment rate looks good.  Also, many of the new jobs being added are coming in the form of low wage labor.
The math is rather clear here:
employment-us-by-segment
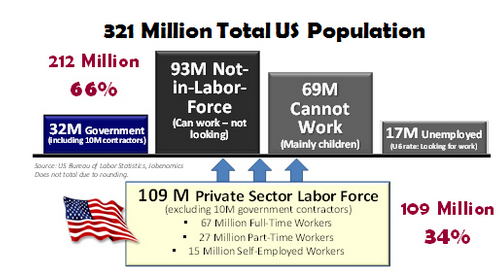
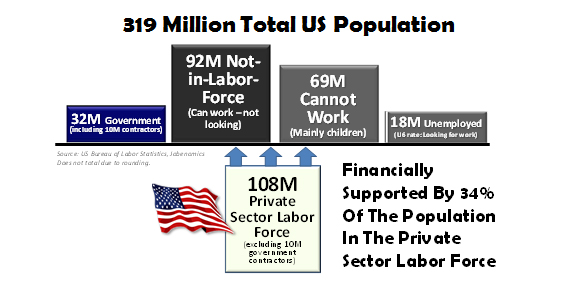
The numbers show an interesting situation.  You have 321 million Americans.  109 million work in the private labor force.  69 million can’t work and this group is mostly made up by children.  However, that 93.2 million group of not in the labor force is large and is a mix bag of data.  This is where the funny math shows up.
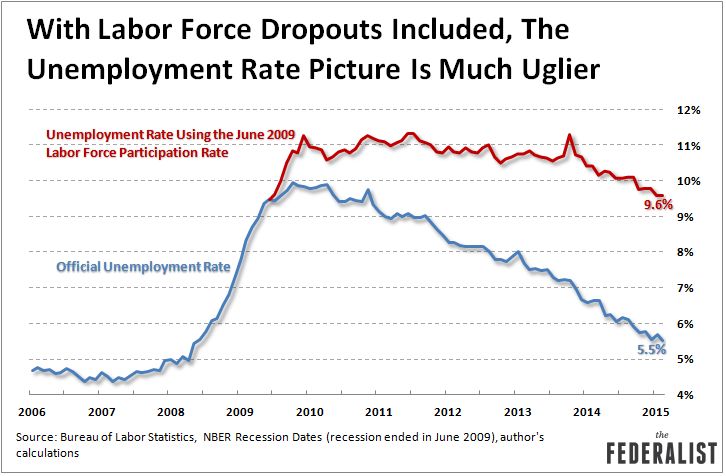
Take a look at the unemployment rate in context of the participation rate:
Unemployment-Rate-With-Labor-Force-Dropouts-March-2015
There is a gigantic difference between 9 percent unemployment and 5 percent.  Of course when you keep adding people to the not in the labor force category, the unemployment rate simply looks a lot better.  One argument we get is that many Americans are simply hitting retirement age.  It is one thing to hit retirement age and another thing to stop working completely.  We’ve discussed this before and highlight that many older Americans are broke and are living on the edge.  Social Security is the one thing keeping many from being destitute on the streets.
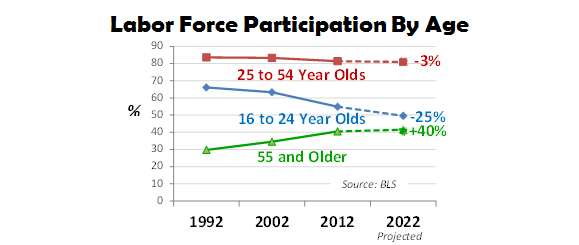
In fact, the labor force participation rate has fallen for nearly everyone 55 and younger:
Labor-Force-Participation-By-Age
So much for the old wealthy retiree argument.  Many older people have to work not by choice.  What is happening is that more wealth is being aggregated in the hands of the few.  A large portion of this wealth is part of the “debt machinery” that is causing large inflation across the economy.  Those telling you that inflation doesn’t exist are like the group saying there is no large “not in the labor force” category.  The cost of the following items has soared since 2000:
-College tuition
-Housing
-Health care
-Food
-Energy
-Automobiles
Yet somehow, inflation doesn’t exist.  What is troubling is this trend is going to continue.  We have 1 out of 3 people in the US supporting the rest.  As I just mentioned, most older workers (a growing portion of the population) are depending on Social Security for their livelihood.  This means more younger workers are needed.  Yet many younger workers are part of the low wage job sector.  You see how this is setting up for a tough situation in a few years.  But like most things, we will simply kick the can down the road until the next crisis hits.

7,231,000 Lost Jobs: Manufacturing Employment Down 37% From 1979 Peak

CNS News
May 13, 2015

(CNSNews.com) - The number of jobs in manufacturing has declined by 7,231,000--or 37 percent--since employment in manufacturing peaked in the United States in 1979, according to data published by the Bureau of Labor Statistics.
The real median household income of Americans who have completed high school--but have not attained a higher degree--also peaked in the 1970s and has declined since then.
In fact, according to the Census Bureau (Tables H-13 and H-14), the real median household income of an American householder who has completed four years of high school peaked in 1973 at $56,395 in constant 2013 dollars. By 2013, it was down to $40,701. That is a drop of $15,694--or 27.8 percent. (The Census Bureau's Table H-14 publishes the annual median household income from 1960 through 1990 of householders who have "completed" four years of high school. Table H-13 publishes the annual median household income of householders who have 'graduated" from high school or its equivalency from 1991 through 2013.)
According to the BLS’s seasonally adjusted employment numbers, employment in the U.S. manufacturing sector hit a peak of 19,553,000 in June 1979. In April 2015, there were only 12,322,000 employed in the manufacturing sector. That is a decline of 7,231,000—or 37 percent.
The decline has even been greater as a share of the civilian noninstitutional population, which includes all U.S. residents 16 and older who are not on active duty in the military or in an institution such as a prison or nursing home. (This is the population number that forms the foundation of the BLS’s employment numbers.)
In April 1973, the year median household income peaked for householders who have completed high school but not earned a higher degree, there were 146,459,000 in the civilian noninstitutional population and employment in manufacturing was 18,359,000—or 12.5 percent of the civilian noninstitutional population.
In April 2015, there were 250,266,000 in the civilian noninstitutional population and employment in manufacturing was 12,272,000—or 4.9 percent of the civilian population.
In 1973, manufacturing employment as a share of the civilian noninstutional population was 2.5 times what it is today.

Americans Not In The Labor Force Rise To Record 93,194,000

Zero Hedge
May 8, 2015

In what was an "unambiguously" unpleasant April jobs payrolls report, with a March revision dragging that month's job gain to the lowest level since June of 2012, the fact that the number of Americans not in the labor force rose once again, this time to 93,194K from 93,175K, with the result being a participation rate of 69.45 or just above the lowest percentage since 1977, will merely catalyze even more upside to the so called "market" which continues to reflect nothing but central bank liquidity, and thus - the accelerating deterioration of the broader economy.

End result: with the civilian employment to population ratio unchanged from last month at 59.3%, one can easily on the chart below why there will be no broad wage growth any time soon, which will merely allow the Fed to engage in its failed policies for a long, long time.

In 1 in 5 Families in U.S., No One Works

CNS News
April 28, 2015

(CNSNews.com) -- In 19.9 percent of American families in 2014, according to data released by the Bureau of Labor Statistics (BLS), no one in the family worked.
A family, as defined by the BLS, is a “group of two or more persons residing together who are related by birth, marriage, or adoption.  In 2014, there were 80,889,000 families in the United States,  and in 16,057,000 of those families, or 19.9 percent, no one had a job.
not working
The BLS designates a person as “employed” if “during the survey reference week” they “(a) did any work at all as paid employees; (b) worked in their own business, profession, or on their own farm; (c) or worked 15 hours or more as unpaid workers in an enterprise operated by a member of the family.”
Members of the 16,057,000 families in which no one held jobs could have been either unemployed or not in the labor force. The BLS designates a person as unemployed if they did not have a job but were actively seeking one. The BLS designates someone as not in the labor force, if they did not have a job and were not actively seeking one.
The BLS has been tracking data on employment in families since 1995. That year, the percent of families in which no one had a job was 18.8 percent. The percentage hit an all-time high of 20.2 percent in 2011. It held steady at 20 percent in 2012 and 2013. In 2014, it declined to 19.9 percent.
Barack Obama and Joe Biden
(AP Photo)
The BLS also calculates these data for single-parent families. In 25.6 percent of families maintained by women with no spouse present, no family member is employed. In 17 percent of families maintained by men with no spouse present, no family member is employed.
The data on employment in families is based on the Census Bureau’s Current Population Survey of the civilian non-institutional population, which includes people 16 and older, who are not on active duty in the military or in an institution such as a prison, nursing home or mental hospital.

The new American retirement plan equates to working forever: Nonexistent nest eggs and most Americans are bad at planning as to how long they will live.

MyBudget360
April 24, 2015

The idea of retirement is a modern one especially when it comes to saving and having a nest egg.  In the past, retirement was only a luxury afforded to a small number of wealthy families.  The rest of the population was destined to work until they died.  That may seem harsh but that is historical fact.  After World War II the idea of mass retirement started to take hold.  Even Social Security was merely a safety net to keep you from starving or being homeless.  Social Security was never designed as the main source of income for retirees but that is what it has become.  Many older Americans simply did not prepare adequately.  The taking away of pension plans was supposed to usher in the era of the self-directed 401k.  One generation later the results are in and Americans are looking into the new retirement plan.  The new retirement plan is working forever (in other words, until people can no longer physically hold down a job).  This certainly doesn’t coincide with the brochures we see of older Americans galloping across the beach with cocktails in their hands.
The retirement savings crisis
Saving for retirement is flat out unsexy.  Advertising is designed to separate Americans from their money even if it involves them going into massive levels of debt.  Is it better to squirrel $500 a month away for 30 years in a boring index fund or is it better to lease a brand new shiny car?  Most opt for the car.  Also, with the median household income of $50,000 and the cost of living soaring, many Americans just don’t have money to set aside after all the bills are paid.
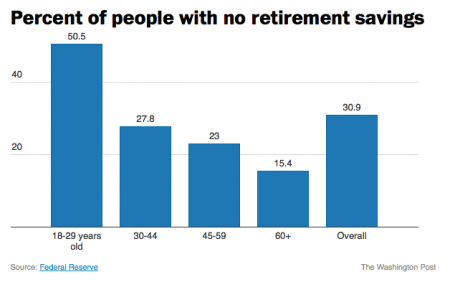
One scary fact is 30 percent of Americans flat out have zero dollars in retirement savings:
retirement-savings
And according to Census data the typical American household (bias by older families) has something like $17,000 to their name when we remove housing equity.  In other words, most Americans are not prepared for a long retirement.  And old age for many will be many years.  This is why you see many older Americans working deep into old age.  They simply need the money.  Food costs are high.  Housing costs are high.  And for this age group, healthcare costs are soaring.  Because of these changes people are pushing retirement age deeper into the future.
Average age of when people will retire and life prediction
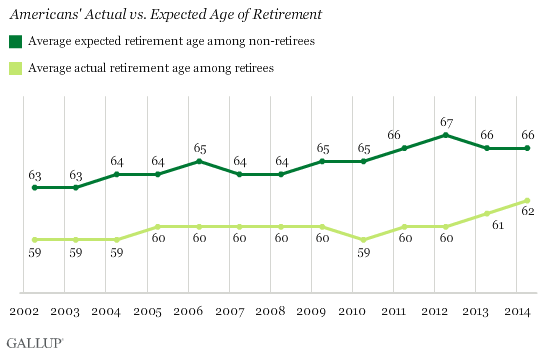
Even as the economy recovered, the average age of expected and actual retirement has jumped up:
average age of retirement moving up
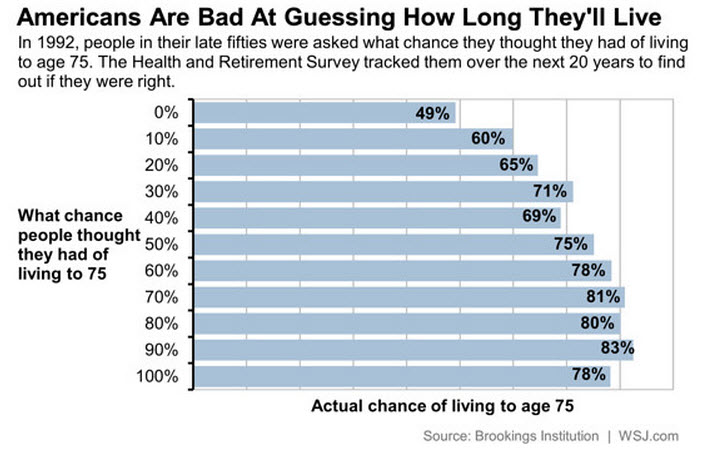
Americans are working more years than they once would have expected.  Having a nest egg is crucial to being able to retire.  And many Americans simply do not have adequate savings.  Planning for the future is difficult.  Many Americans are bad at planning how long they will live:
predictinghowlonglive
What does the chart above show?  That people over estimate how long they will live.  But this is also telling regarding psychology.  If people are so confident they will live late into life (75+) why are they planning so poorly when it comes to retirement?  The answer is the cost of living is soaring, inflation really does exist, and people still want to pretend like they are millionaires even though they are broke without debt.
Retirement money held in the hands of the few
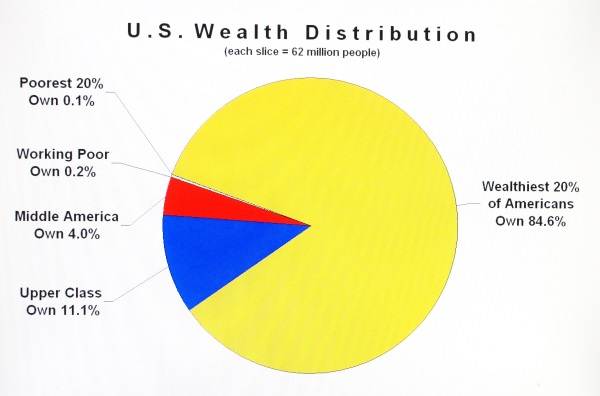
Half of Americans don’t own one stock.  And the bulk of wealth is in the hands of a few.  84 percent of the nation’s wealth is held in the hands of the top 20 percent:
wealthdistribution
The rest whether they admit it or not, are going to rely on Social Security.  Most retired Americans rely on Social Security as their primary source of income.  Half of people on Social Security would be out on the streets if it were not for their monthly payment.  As far as retirement planning goes, there very little retirement or planning going on.  And we have 10,000 Americans hitting retirement age per day for the next decade.

Record 93.2 million Americans now not in the labor force: The not in the labor force rebound added 277,000 Americans in March alone.

MyBudget360
April 10, 2015

In the last year alone we have added 2.1 million Americans to the “not in the labor force” category.  This mysterious category continues to grow and is having a field day with the employment data.  It is hard to ignore this number because it represents a large portion of our population that is simply not counted in the labor force data.  You have older Americans in this category but you also have a large number of people wanting work and simply not being able to find it.  You also have many relenting and taking up work in the low wage segment of our economy.  The unemployment rate would have you believe that this is a fantastic recovery but in March alone we added 277,000 to the not in the labor force category while only 126,000 jobs were created.  It is becoming more apparent there will be a strain on the one-third of Americans supporting the other two-thirds.
Non-working America
There seems to be this selective blindness to this group.  The narrative that tries to explain this growth away is that older Americans are simply retiring.  This is more myth than fact.  First, retirement assumes that many older Americans have the means to retire.  The reality is, half of older Americans on Social Security would be in poverty if it were not for that monthly check.  Many older Americans are working into old age because they have to.  Another segment is the group of people meandering in college. Most are there to gain an education and grow.  Many are there going into deep debt with a degree that will probably yield very little in the marketplace.
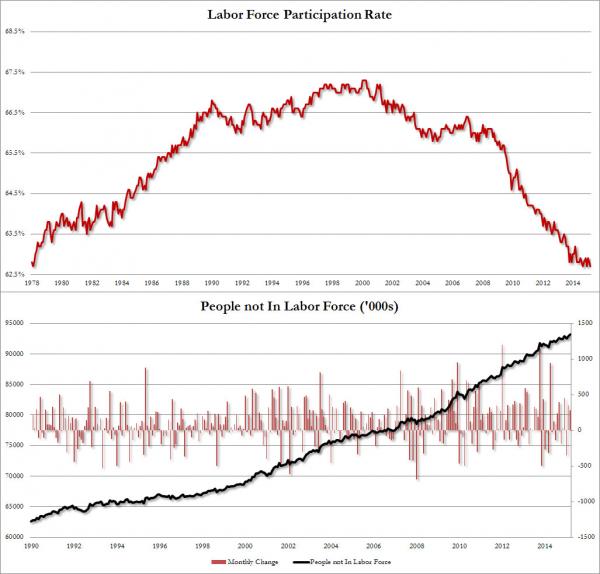
We have some significant structural issues to confront here.  Take a look at this growth:
LFP_0
93.2 million Americans are now not in the labor force.  In the last year alone we’ve added 2.1 million to this category.  This is a staggering amount to an already large group.  What makes it more difficult is that you have a larger burden of production being placed on those in the private sector.  One-third of Americans are supporting two-thirds of the population:
319-Million2
“Those in the private workforce are basically keeping things rolling for the rest.  Now in this category of non-workers you have retirees and children but a big number is coming from people that should be working if this was truly some broad based recovery.”
The recovery is selective at best.  It has helped the rentier class do better by juicing up the stock market and punishing savers.  Wall Street has done a great job of crowding out the housing market making rents and home prices higher just because of the easy money policy used to bail out banks.  But how has this helped the overall economy?  You have most jobs coming in the low wage service sector and income growth is stagnant.
93.2 million Americans are not in the labor force, a record number that can’t be simply accounted for by retiring Americans.  And keep in mind that many older Americans are going to rely heaving on Social Security and Medicare as healthcare costs rise.  Where is the money going to come from?  Many young workers are just trying to get by and shifting demographics are going to make this inverted pyramid a difficult task to carry forward.
Those not in the labor force is largely ignored by the press because it doesn’t show up in the headline unemployment rate.  So what that we added 277,000 to this category last month alone?  It is as if this group just disappears off the statistics chart every month.  However having 93.2 million not in the labor force is a hard number to ignore.

When working leads to food stamp usage and the rise of dollar stores: Food stamp usage is still near record levels even in the face of a dropping unemployment rate.

MyBudget360
January 20, 2015

Food stamp usage surges when the economy enters into a recession.  That is no surprise.  In fact, this is the design of the program.  A safety net when things get bad.  But if we are to believe headline indicators, the economy is improving so we should see food stamp usage decline substantially.  It has not.  Thanks to the low wage recovery, you have a new class of working poor.  We still have an incredibly high number of Americans on food stamps as we start 2015.  Dollar stores have done a great job capitalizing on this army of people needing low cost items to buy.  Instead of selling trivial junk, many dollar stores now make most of their volume through food sales.  Working and being on food stamps doesn’t seem like a perfect combination but it is if you are one of the millions in thelow wage economy.  As we will highlight in this article, we are finding a high number of Americans unable to dig themselves out of the hole set from the Great Recession.
The permanently high number of Americans on food stamps
It is typical to have food stamp usage fall when the unemployment rate declines.  The stock market is near a peak so you would expect that this would be trickling down throughout the economy.  It is not.  Food stamp usage is remaining stubbornly high.
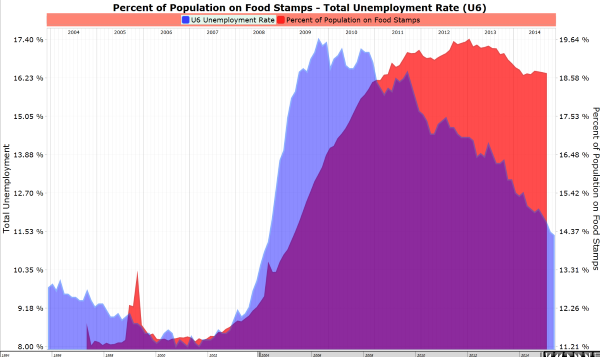
Take a look at this chart:
food stamp and unemployment rate
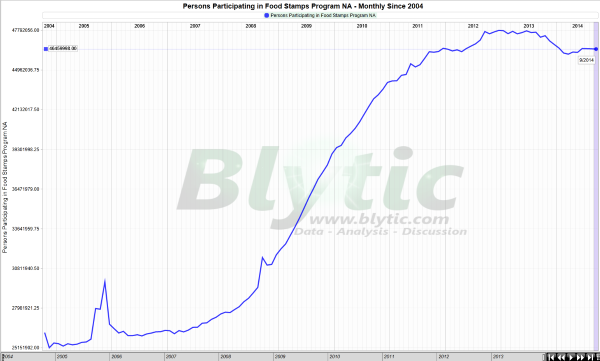
Unemployment went up and so did food stamp usage.  No surprise.  But as the unemployment rate fell, the percentage of Americans on food stamps has remained very high.  There is a big gap going on here.  We still have 46 million Americans on food stamps:
mb360 food stamp usage
The program actually faced cuts recently which doesn’t make much sense since most people on food stamps are truly poor.  We also have many that are working but still don’t make enough to cover basic necessities like food.  Some states have nearly half of their adults not working.  What you have unfolding is some structural damage to the underlying workforce.
The rise of dollar stores
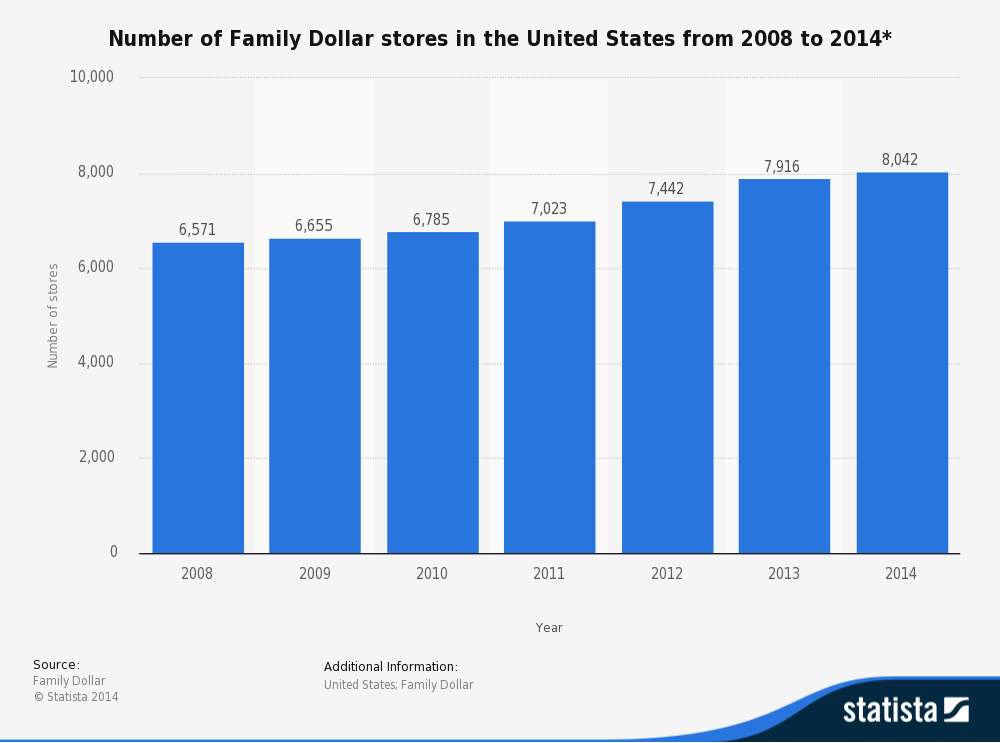
It should then be no surprise that we have a large growth in dollar stores across the country.  Take a look at the growth of Family Dollar stores in the US:
number-of-family-dollar-stores-in-the-united-states
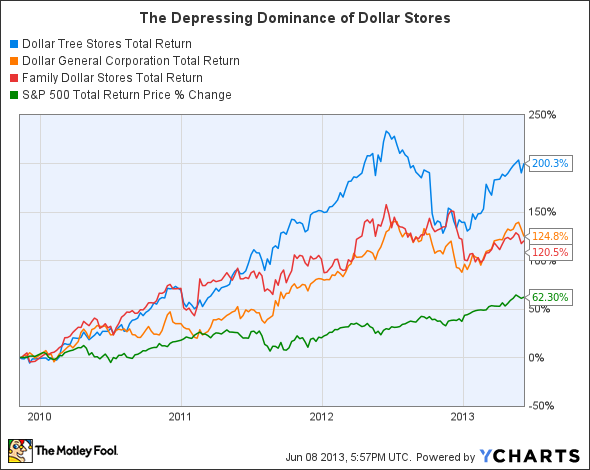
More than 8,000 Family Dollar stores are now in the US.  This is a healthy increase from 6,500 back in 2008.  It is also no surprise that dollar stores have done exceptionally well on the stock market:
dollar-store-chart
When you have 46+ million Americans on food stamps in what is supposed to be a solid economic recovery, you have to really ask what is happening to the underlying workforce.  You also haveone-third of working Americans supporting the other two-thirds.  These kind of numbers are simply not conducive to sustaining a solid middle class.
It is no surprise then that the first major initiatives coming out in 2015 are dealing with the middle class.  2016 should be a year focused on middle class challenges.  Yet how do you confront these challenges?  The goods sold at these stores are at low costs because labor costs are kept low.  Many of the products are brought in from lower cost countries.  Do you raise costs and pass them off to people that can’t clearly afford it?  You can see the conundrum here.
There are no easy answers here but you can be sure that business at dollar stores will remain consistent for years to come.